
Analysis
Fed Rate Hike 2026: Kevin Warsh’s Hawkish Pivot Explained | Impact on Mortgages & Markets

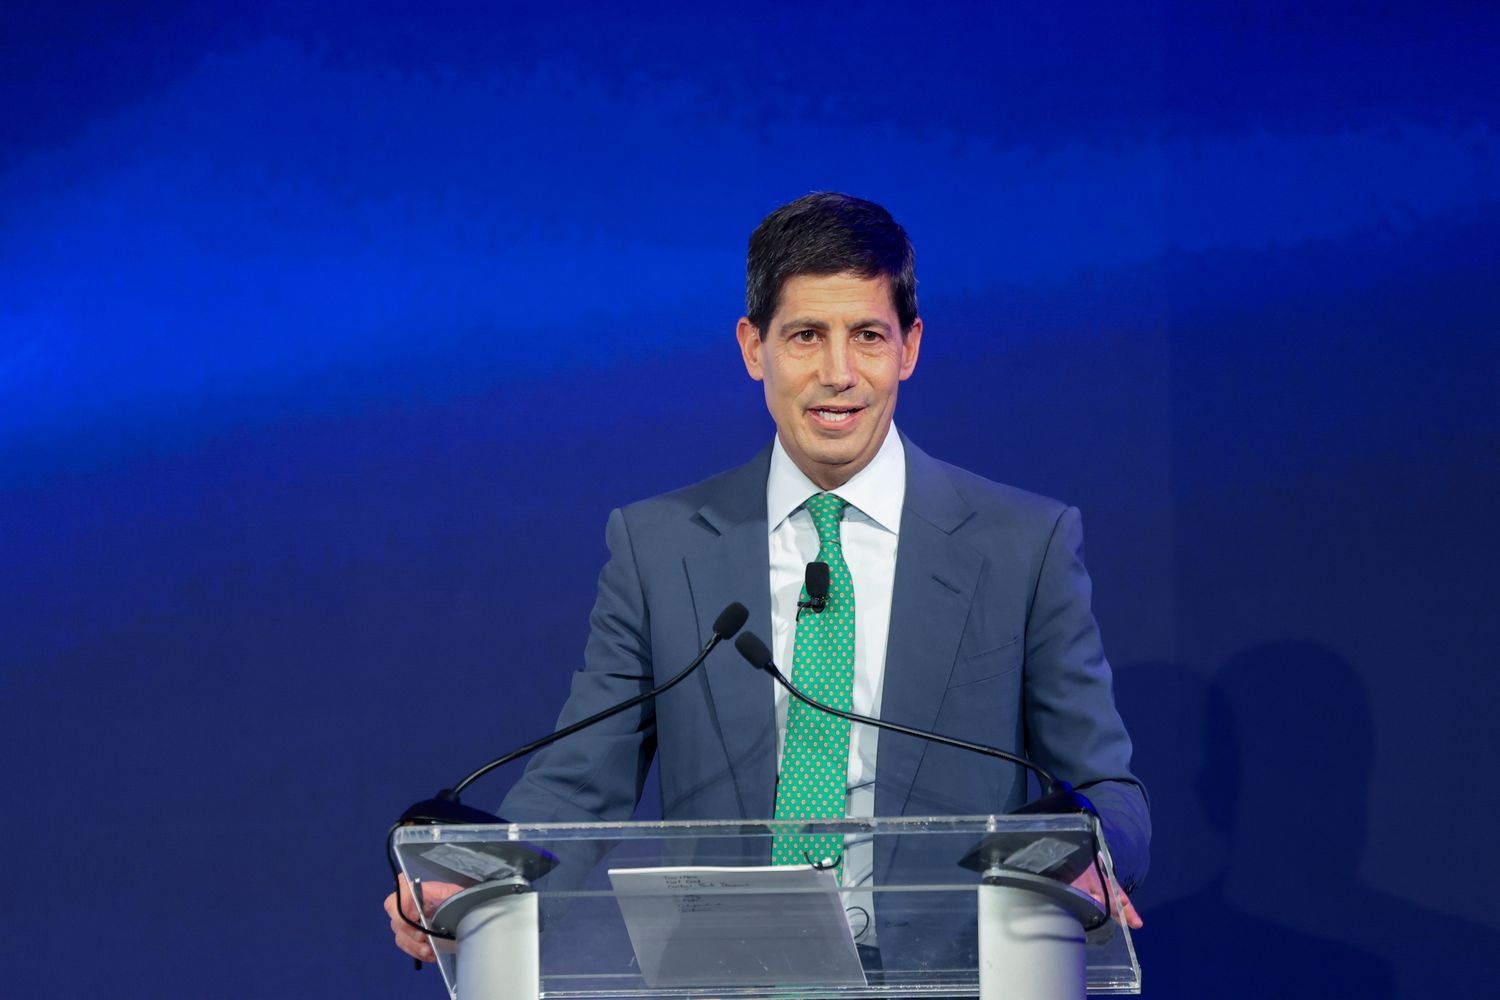
Nine Fed officials now project a 2026 rate hike after Kevin Warsh’s debut FOMC meeting. Here’s what the hawkish pivot means for inflation, mortgages, stocks, and the US economy.
The Federal Reserve delivered one of the most consequential policy surprises of 2026 on June 17, when new Chair Kevin Warsh held interest rates steady at 3.50%–3.75% but allowed the Fed’s updated projections to do the hawkish talking for him. Nine of 18 Federal Open Market Committee members now pencil in at least one rate hike before year-end — a seismic reversal from March, when no policymaker foresaw tightening and the consensus leaned toward cuts.
For households carrying mortgages, credit card balances, and auto loans, the message was unmistakable: the era of cheap money is not returning anytime soon.
Table of Contents
The June FOMC Meeting: A Debut That Shook Markets
Warsh’s first FOMC press conference was, by design, terse. The Fed’s policy statement shrank from roughly 300 words to just 130, stripping out the customary forward guidance that markets had relied upon for years. The truncated statement acknowledged that inflation remains “elevated” partly due to energy “supply shocks” — a nod to Middle East conflict disruptions — but offered no explicit signal about the direction of the next move.
Warsh did not submit a dot-plot forecast for himself, an unusual omission that he justified by saying he did not want to lock the institution into a predetermined path. “I did not submit a dot for me,” he said at the press conference. “It’s not helpful in the conduct of policy.”
What his colleagues submitted, however, told the real story. Six of the nine officials who projected a hike penciled in two quarter-point increases — a path that would push the benchmark rate to 4.25%–4.50% by year-end.
Why This Is a Bigger Deal Than It Looks
The June pivot is not merely a shift in one metric. It represents a fundamental change in the Fed’s risk calculus under Warsh’s leadership.
US inflation hit 4.2% year-over-year in May 2026, its highest level in more than three years — double the Fed’s 2% target. The sustained overshoot reflects a combination of factors: geopolitical energy disruptions from the US-Iran conflict, persistent services inflation, and a labor market that has proven more resilient than forecast. May payrolls surprised sharply to the upside for the third consecutive month, erasing the narrative of an imminent growth slowdown.
Bank of America revised its rate forecast following the June meeting, now projecting three quarter-point hikes — bringing the federal funds rate to 4.25%–4.50% — compared to its previous base case of no change through 2026. Deutsche Bank’s chief US economist described the June outcome as a clear signal that “the risk that they might need to raise rates has clearly risen.”
Traders on the Kalshi prediction market are pricing in a 57% probability of at least one hike in 2026, a figure that has climbed sharply since the June FOMC outcome.
Market Reaction: Stocks Fall, Yields Surge
Markets moved swiftly to price in the hawkish shift. On June 17:
- The Dow Jones Industrial Average fell 507 points (-0.98%)
- The S&P 500 dropped 1.21%
- The Nasdaq Composite shed 1.34%
- Two-year Treasury yields surged 16 basis points to 4.21%, their highest level in over a year
- The US Dollar Index posted its best single-day gain in nearly a year
- Gold fell more than 2%, reflecting expectations that higher rates would strengthen the dollar and raise the opportunity cost of holding the metal
The bond market’s reaction was particularly telling. Short-term yields — which are most sensitive to Fed policy expectations — moved significantly more than long-term yields, a pattern that typically accompanies genuine tightening expectations rather than speculative noise.
What Kevin Warsh’s Policy Philosophy Means Going Forward
Warsh arrived at the Fed’s helm with a reputation as a skeptic of its communication strategy. He has long argued that the central bank “stops talking so much” about its decisions and that market participants place “undue weight on Federal Reserve communications.”
His debut press conference was evidence of this philosophy in action. He hinted at fewer press conferences and announced five task forces to review how the Fed communicates, what data it uses, and how it frames inflation — all with the stated goal of making the institution “clear-eyed and focused on the future.”
The practical implication for investors: forward guidance from the Fed will become less reliable as a tool for navigating markets. Under Warsh, data — not Fed communication — will drive positioning.
Warsh’s strategic posture may also be intentionally hawkish for credibility purposes. As BofA analysts noted, it is possible that Warsh is being “strategically hawkish to gain credibility while biding his time to cut later.” The risk, however, is that inflation surprises to the upside and forces the Fed’s hand before any such pivot can occur.
What This Means for Household Finances
Mortgages
The 30-year fixed mortgage rate does not move in lockstep with the federal funds rate but is heavily influenced by Treasury yields. With the 10-year note yield hovering near 4.5% in late June 2026, mortgage affordability remains severely constrained. Any additional Fed tightening would likely push yields — and mortgage rates — higher still.
Credit Cards
Credit card interest rates, which are directly indexed to the prime rate, would rise automatically with any federal funds rate increase. With average credit card APRs already in double digits, a 50–75 basis point tightening cycle would add meaningful costs for consumers carrying revolving balances.
Savings Accounts and CDs
The flip side of higher rates: savings accounts, money market funds, and certificates of deposit would offer more attractive yields. Consumers who have parked cash in these instruments stand to benefit from any tightening.
Auto Loans
New and used vehicle financing costs have already climbed substantially since 2022. Further rate increases would extend the affordability squeeze in the auto market.
The Political Dimension
Warsh was appointed by President Trump after the administration’s prolonged and public confrontation with his predecessor, Jerome Powell, over the pace of rate cuts. The irony is palpable: Warsh was selected with an expectation — at least in some circles — that he would be more accommodative. The June FOMC outcome appeared to disappoint the White House. Trump, speaking to reporters in Paris before departing for a G7 dinner in Versailles, said that higher interest rates “keeps the country down.”
Powell, for his part, remains on the Fed’s governing board and voted at the June meeting in favor of holding rates at approximately 3.6% — a small act of continuity in an institution undergoing significant change.
The Bottom Line
The June 2026 FOMC meeting marks an inflection point in US monetary policy. Kevin Warsh has signaled that the Fed will prioritize inflation credibility over growth accommodation — even if that puts him at odds with the White House, Wall Street’s rate-cut consensus, and households hoping for mortgage relief.
With inflation at a three-year high, a resilient labor market, and nine FOMC members already projecting hikes, the path of least resistance for US interest rates is now upward. The question is not whether the Fed tightens further, but how fast and by how much.
Investors, homeowners, and borrowers would be prudent to model for a federal funds rate of 4.25%–4.50% by the end of 2026 — and to position accordingly.
FAQ
Q: Will the Federal Reserve raise rates in 2026?
A: Nine of 18 FOMC members projected at least one rate hike in their June 2026 dot plot, and Bank of America now forecasts three quarter-point increases by year-end. While not certain, the probability of at least one hike before December has risen sharply.
Q: Who is Kevin Warsh and why does he matter?
A: Kevin Warsh is the new Chair of the Federal Reserve, appointed by President Trump in 2026. His debut FOMC meeting in June delivered a hawkish surprise, with a dramatically shortened policy statement and a press conference that signaled a move away from traditional forward guidance.
Q: How does the Fed dot plot work?
A: The dot plot is a chart showing each FOMC member’s projection for where the federal funds rate should be at the end of each year. In June 2026, nine members projected at least one rate hike, a significant shift from March when no members foresaw tightening.
Q: How will a Fed rate hike affect mortgage rates?
A: Mortgage rates are primarily tied to 10-year Treasury yields rather than the federal funds rate directly, but Fed tightening pushes Treasury yields higher, which feeds through to mortgage costs. Further hikes in 2026 would likely keep 30-year fixed rates elevated or push them higher.
Discover more from The Monitor
Subscribe to get the latest posts sent to your email.




“Min Ah” is one of the most searched names in Korean drama, and it points to more than one actress. The one driving the biggest buzz right now is Shin Min-a.
Key Takeaways
- Biggest news: Shin Min-a stars as Empress Navier in Disney+’s The Remarried Empress, which premieres November 4, 2026, per Soompi.
- Cast: Ju Ji-hoon plays Emperor Sovieshu, Lee Se-young plays Rashta, and Lee Jong-suk plays Prince Heinrey.
- Scale: the story is based on a web novel and webtoon that recorded about 2.97 billion cumulative global views as of July 2026, and it is Disney+’s first K-romance fantasy (SBS Star).
- Name confusion: other well-known “Min Ah” performers include Kang Min-ah and Minah (Bang Min-ah) of Girl’s Day. This article explains who is who.
| Name | Known for | Latest news |
|---|---|---|
| Shin Min-a | Leading roles in major dramas and films | The Remarried Empress (Nov 4, 2026) |
| Kang Min-ah | Actress represented by H&Entertainment | Drama Sympathetic Cells with Kim Myung-soo; premiere date announced June 2026 (MyDramaList) |
| Minah (Bang Min-ah) | Former Girl’s Day member turned actress | Born May 13, 1993; Girl’s Day debut in 2010 (Dramabeans) |
Shin Min-a’s Next Big Role: The Remarried Empress
Disney+ confirmed on August 26 that the series would premiere on November 4, releasing a teaser and character posters (Soompi). The story follows Navier, the “perfect empress” of the Eastern Empire, who is told by her husband that he wants a divorce after he falls for a runaway slave, Rashta. Instead of accepting defeat, Navier asks permission to remarry, choosing the prince of a rival kingdom.
Release plan
According to industry coverage, the ten-part series will debut with a four-episode drop and then release two episodes each Wednesday through a November 25 finale, and it streams on Hulu in the U.S. (Resonate). The same report says the first three episodes will screen at the Busan International Film Festival, which runs October 6–15.
Why it matters
This is the clearest sign of how K-drama has become a global asset. Platforms are paying for fantasy adaptations of internet-born stories with huge built-in audiences, and they are casting established leads to carry them.
Why Shin Min-a’s Popularity Travels
- Longevity. She has worked consistently in Korean drama since the early 2000s, and her credits on MyDramaList span more than two decades (MyDramaList).
- Genre range. From romantic comedy to Netflix thriller Karma and a 2026 film, The Eyes, in which she plays dual roles (MyDramaList).
- Global platforms. Disney+, Netflix, and Hulu give Korean series simultaneous worldwide releases.
The Other “Min Ah” Actresses
Kang Min-ah
A Seoul-born actress with credits since the 2010s. MyDramaList lists a 2026 drama, Sympathetic Cells, with Kim Myung-soo, whose premiere date was announced in June (MyDramaList).
Minah (Bang Min-ah)
She debuted with Girl’s Day in 2010, made her acting debut on the tvN variety program Roller Coaster, and later won a Best New Actress trophy at the 2013 Gwangju International Film Festival for the film Holly. She led the 2020 film Snowball, which earned a Screen International Rising Star Asia Award at the New York Asian Film Festival (Dramabeans).
How to Search the Right Person
Add the family name: “Shin Min-a,” “Kang Min-ah,” or “Bang Minah.” Spelling varies in English (Min-a, Mina, Min Ah), which is why results get mixed.
Frequently Asked Questions
Who is Min Ah in K-drama?
There are several, but the most prominent right now is Shin Min-a, starring in The Remarried Empress.
When does The Remarried Empress premiere?
November 4, 2026, on Disney+ (Soompi).
Who is in the cast?
Shin Min-a, Ju Ji-hoon, Lee Jong-suk, and Lee Se-young.
Is Min Ah the same as Minah from Girl’s Day?
No. Minah is Bang Min-ah, a different performer (Dramabeans).
How popular is the source story?
The webtoon had about 2.97 billion global views as of July 2026 (SBS Star).
Whichever Min Ah you were searching for, the pattern is the same: Korean drama talent now finds its audience everywhere at once.
Discover more from The Monitor
Subscribe to get the latest posts sent to your email.
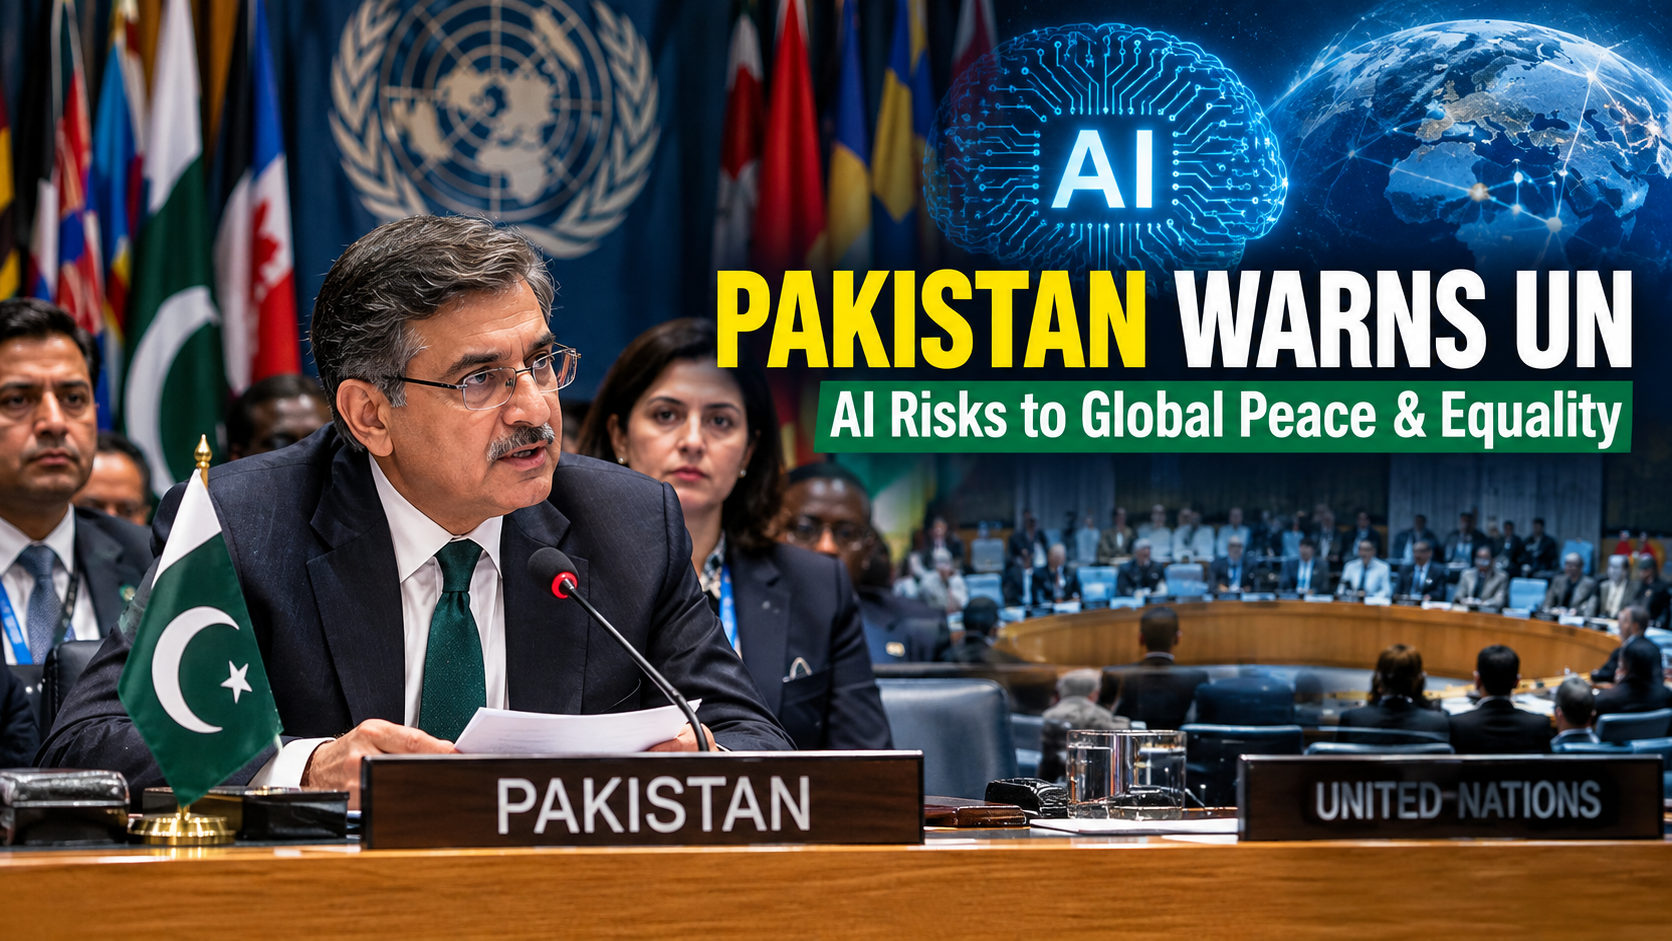
UNITED NATIONS — September 24, 2026: Pakistan has warned the United Nations Security Council that the rapid and insufficiently regulated development of artificial intelligence could deepen global inequality while creating new risks to international peace and security.
Speaking during a Security Council briefing on “Artificial Intelligence and International Security,” Pakistan’s Deputy Prime Minister and Foreign Minister Senator Mohammad Ishaq Dar called for stronger international safeguards, regulatory frameworks and governance mechanisms to address the risks associated with increasingly powerful AI systems.
Dar emphasized that the international community needs coordinated action to establish guardrails around artificial intelligence, particularly as AI technologies become increasingly relevant to military decision-making, information systems and national security.
Pakistan Calls for International Guardrails on Artificial Intelligence
Pakistan’s intervention comes as governments and international institutions increasingly debate how AI should be governed across borders.
Dar stressed the importance of restraint and confidence-building measures in the military domain, particularly because AI-assisted systems could compress decision-making timelines and increase the danger of miscalculation.
The concern is significant because artificial intelligence is no longer confined to civilian applications. AI is increasingly being examined in relation to cyber operations, intelligence analysis, autonomous systems, information warfare and other security-sensitive areas.
The United Nations has also warned that AI can create substantial risks when technological development moves faster than international governance.
The UN’s existing AI framework emphasizes responsible, accountable, transparent and human-centered development, while calling for effective human oversight of AI systems.
Why AI Is Becoming a Security Council Issue
The Security Council has previously considered artificial intelligence as a potential factor affecting international peace and security, but the technology has developed rapidly since those early discussions.
A recent analysis by the independent Security Council Report identified several security implications, including AI’s ability to facilitate malicious cyber activity, accelerate the creation and distribution of misinformation and disinformation, and influence military operations.
The organization also highlighted concerns surrounding increasingly autonomous weapons systems, shortened decision-making timelines and questions about human oversight and accountability.
These concerns help explain why AI has moved beyond being primarily a technology-policy issue and increasingly become a subject of international security diplomacy.
The challenge for governments is that AI can simultaneously create opportunities and risks.
AI could help countries identify emerging conflicts, improve humanitarian operations, monitor ceasefires and analyze large quantities of information. At the same time, poorly governed systems could amplify security threats or make already complex conflicts more difficult to manage.
Pakistan Highlights the Global Inequality Dimension
Pakistan’s message to the Security Council went beyond military applications.
Dar also emphasized the need for AI development to be representative, transparent and inclusive, reflecting concerns among developing countries that the benefits of advanced artificial intelligence could become concentrated among a relatively small group of technologically advanced states and companies.
That concern is already reflected in the United Nations’ Global Digital Compact.
The Compact calls for closing digital divides, expanding access to the benefits of the digital economy and strengthening international governance of artificial intelligence. It specifically calls for full and equal representation of countries, including developing nations, in international AI governance.
This makes AI access and governance part of a broader development question.
Countries with advanced computing infrastructure, large datasets, sophisticated research institutions and substantial private-sector investment are positioned differently from nations that remain dependent on imported technologies and have limited domestic AI capacity.
If that gap widens, AI could potentially reinforce existing economic and technological inequalities rather than reduce them.
UN Framework Already Calls for Inclusive AI Governance
The debate at the Security Council is taking place alongside a broader UN effort to develop international mechanisms for AI governance.
The Global Digital Compact, adopted as part of the Pact for the Future, established a framework for international cooperation on digital technologies and AI.
The United Nations has subsequently established an Independent International Scientific Panel on Artificial Intelligence and a Global Dialogue on AI Governance.
The first annual Global Dialogue took place in Geneva in July 2026, bringing together governments and other stakeholders to discuss international cooperation, AI opportunities and emerging risks.
The UN says the dialogue is intended to ensure that AI governance reflects the priorities of all nations rather than only those with the greatest technological capabilities.
For developing countries such as Pakistan, this process provides an avenue to raise questions about technological access, capacity-building, data governance and participation in international rule-making.
AI and Military Decision-Making Raise Particular Concerns
One of the most sensitive areas in the AI debate is military decision-making.
AI can process enormous volumes of information far faster than humans. That capability could potentially assist military planners and governments, but it also raises questions about what happens when decisions involving force are increasingly influenced by automated systems.
A shorter decision-making cycle can create pressure to respond before human officials have fully evaluated the available information.
That is why Pakistan’s emphasis on restraint and confidence-building is significant in the context of international security.
The broader UN position has also stressed the importance of retaining meaningful human control over decisions involving the use of force.
The central issue is not simply whether AI should be used in security applications, but how governments can establish accountability when AI-assisted systems contribute to consequential decisions.
Disinformation Adds Another Layer of Risk
AI-generated content presents another challenge for governments and international organizations.
Generative AI can make it easier to create convincing text, images, audio and video at scale. In a conflict environment, such capabilities could complicate efforts to distinguish authentic information from manipulated material.
The UN has identified misinformation and disinformation among the major concerns surrounding artificial intelligence, particularly where manipulated content can affect public trust, human rights or humanitarian operations.
For international institutions, the problem is therefore both technological and political: governments must develop mechanisms capable of addressing harmful AI-generated content without undermining legitimate expression or access to information.
Global AI Governance Is Becoming More Urgent
The current Security Council discussion reflects a larger international shift.
AI governance is no longer being discussed solely in terms of innovation, investment and economic competitiveness. Governments are increasingly considering questions involving national security, international stability, human rights, development and inequality.
The United States and China, for example, continue to compete technologically while also discussing mechanisms for AI safety and communication.
Meanwhile, the UN is developing a more inclusive multilateral framework intended to give countries a role in shaping international AI governance.
That creates an important distinction between AI development and AI governance.
The first concerns how quickly capabilities advance. The second concerns the rules, safeguards and institutions that determine how those capabilities are developed and deployed.
What Pakistan’s Position Means for Developing Countries
Pakistan’s intervention highlights an issue that is likely to remain central to future AI negotiations: who gets to shape the rules governing artificial intelligence?
Developing countries have an interest not only in managing AI-related risks but also in ensuring access to the technology’s potential benefits.
The UN’s Global Digital Compact recognizes the need for capacity-building, technology cooperation and support for developing countries to access, develop, use and govern AI systems.
That approach is particularly relevant as AI becomes increasingly connected to education, healthcare, agriculture, financial services, public administration and economic productivity.
Without adequate access to computing infrastructure, skills, data and investment, developing countries could find themselves primarily consuming technologies designed elsewhere.
Pakistan’s call for representative and inclusive AI governance therefore places technological development and international security within the same broader conversation.
The Challenge Ahead: Rules That Keep Pace With Technology
The Security Council’s latest discussion illustrates the central difficulty confronting policymakers.
Artificial intelligence is developing faster than many traditional regulatory processes can respond.
International rules must address security risks without unnecessarily blocking beneficial innovation. They must also account for differences between developed and developing countries while maintaining fundamental principles such as human rights, transparency and accountability.
The United Nations’ emerging governance architecture is an attempt to address that challenge through scientific assessment, international dialogue and greater participation by countries around the world.
Pakistan’s intervention adds another voice to that debate, particularly on the consequences of unequal access to AI capabilities and the risks associated with AI-assisted military decision-making.
Conclusion
Pakistan’s warning at the UN Security Council underscores the increasingly international character of the artificial intelligence debate.
The issue is no longer simply how quickly AI can advance. It is also about how the technology is governed, who participates in setting the rules, how military risks are controlled and whether the benefits of AI are distributed broadly enough to avoid deepening existing inequalities.
As AI becomes more deeply integrated into security, economies and public institutions, international cooperation will become an increasingly important part of managing both its opportunities and its risks.
For Pakistan and other developing countries, the emerging global AI governance system will be particularly important because the rules established today could influence access to technology, economic opportunities and participation in future international decision-making for years to come.
Discover more from The Monitor
Subscribe to get the latest posts sent to your email.
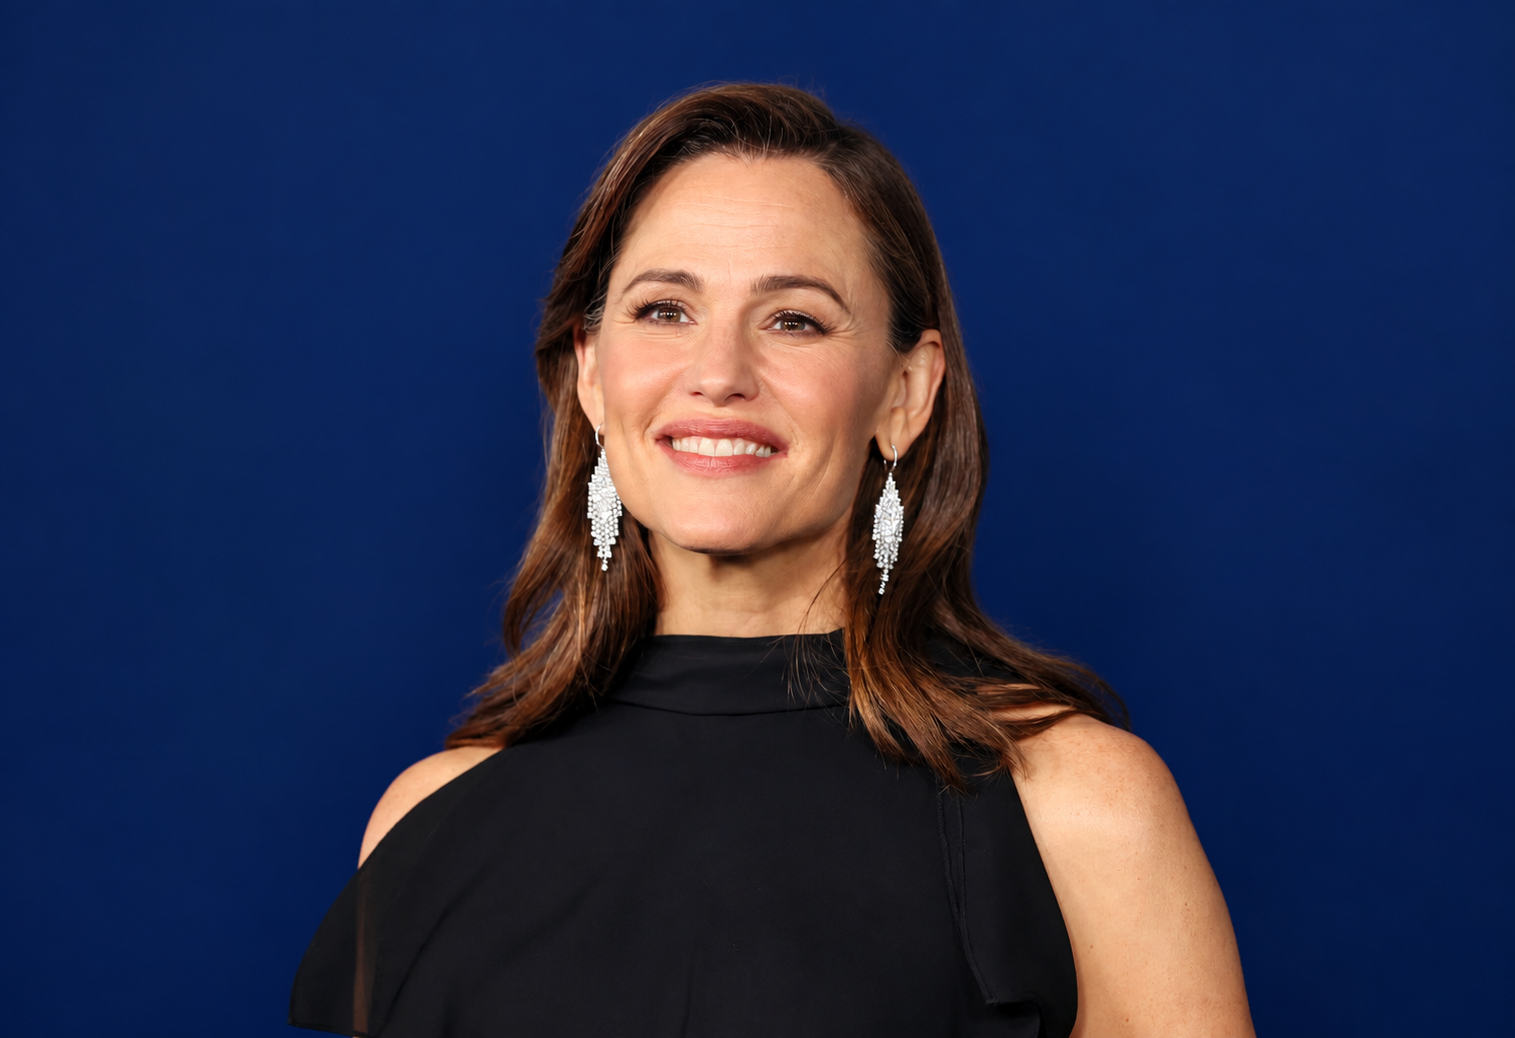
Most celebrity business ventures are licensing deals wearing a founder’s costume. The name goes on the label, the cheque clears, and an operating company nobody has heard of does the actual work.
Jennifer Garner’s is not that. On 6 February 2026, she rang the opening bell at the New York Stock Exchange as Once Upon A Farm went public at $18 per share with a valuation of $724 million.
The company she co-founded is now a listed public entity with audited financials, a board seat in her name, and a stock price that has since gone down. That last detail is the most interesting part of the story.
Key Takeaways
- The IPO: Once Upon A Farm listed on the NYSE as OFRM, raising $197.9 million at the midpoint of its marketed range.
- The pop: shares closed day one up about 17%, then traded at $25.10 by 9 February — nearly 40% above the listing price.
- The reality check: the stock was down about 15% for the year by August 2026.
- The business is real: $225 million in annual revenue for the year ending September 2025, up more than 40%.
- Her role is contractual and disclosed: board director, co-founder and spokesperson, with compensation set out in the S-1.
What Once Upon A Farm Actually Is
The company sells organic, cold-pressed refrigerated food for children — pouches, smoothies, applesauce and oat bars — through grocery retail and direct-to-consumer channels.
It was founded by serial entrepreneurs Cassandra Curtis and Ari Raz, with Garner and CEO John Foraker joining as co-founders two years later. Foraker’s background matters to the credibility of the operation: he ran Annie’s Homegrown for more than a decade and served as a president at General Mills.
Note: founding-date reporting varies between 2011 and 2015 depending on the source. Verify before publication.
The Financial Trajectory
| Metric | Figure |
|---|---|
| Annual revenue (yr ending Sept 2025) | $225 million |
| Year-on-year growth | Over 40% |
| CAGR since 2018 | More than 60% |
| IPO valuation | $724 million |
| Capital raised | $197.9 million |
| Shares sold by company | ~7.6 million |
| Shares sold by existing holders | ~3.4 million |
| Lead bookrunners | Goldman Sachs, JPMorgan Chase |
A compound annual growth rate above 60% sustained over seven years is not a celebrity endorsement outcome. It is a consumer packaged goods outcome — and CPG is one of the hardest categories in which to build distribution from scratch.
What Her Actual Job Is
This is where the Once Upon A Farm story diverges most sharply from the celebrity-brand template, because the terms are public.
The S-1 discloses that Garner serves on the public company’s board of directors and continues as co-founder and spokesperson — “Farmer Jen” — a role for which she was paid $1 million in the prior year, with $2 million to $3 million in expected annual compensation through 2028, separate from stock options and an IPO-linked bonus.
She also worked the roadshow directly. Garner described the investor meetings to Forbes as rooms full of existing customers, noting that families already trusted the product.
That is a meaningful distinction for anyone assessing celebrity-backed companies. There is a difference between a founder who licenses a likeness and a founder who sits on the board, pitches institutional investors and has compensation disclosed in a registration statement.
The Mission Structure
Once Upon A Farm is a public benefit corporation — the “PBC” in its legal name — which means its charter permits management to weigh mission alongside shareholder returns.
Garner has framed the IPO itself as a mission decision. Selling to a major food conglomerate would have cost the existing team control of the business; a listing preserved it while raising capital.
The concrete expression of that mission is WIC certification. Getting products approved so low-income families can purchase them through the federal nutrition programme has been a stated priority, and the brand now holds that distinction in more than 20 states. Garner has called it the company’s north star.
It connects to a longer track record — she had been a trustee for Save the Children for several years before joining the company in 2017.
The Risks the Prospectus Discloses
A public listing forces disclosure that private celebrity ventures never face. Three risks stand out.
Tariff and sourcing exposure. The prospectus highlighted risks related to tariffs and trade barriers, particularly against Mexico and South America, from where the company sources a significant portion of its fruit and vegetable ingredients.
Key-person concentration. A brand built substantially on one founder’s public identity carries a risk no diversified CPG company does.
Acquisition framing. Ahead of the listing, Hedgeye analyst Bennett Cheer characterised the company as an acquisition “play” — a view that treats the IPO as a staging post toward a strategic sale rather than a destination.
The Post-IPO Slide, and What It Tells You
The stock’s path is the honest part of this story. Priced at $18, up 17% on day one, close to $25 within a week, then down roughly 15% for the year by August.
Garner’s stated response has been to ignore the daily price and focus on execution — her position being that the stock follows the mission rather than the reverse.
Whether or not one finds that convincing as investor communication, the underlying pattern is common and worth understanding. Consumer IPOs frequently pop on scarcity — the listing was described as a rare food offering that excited investors — and then reprice once the float settles and quarterly results replace the narrative.
For investors, the lesson generalises. A founder’s celebrity generates demand at listing. It does not generate gross margin.
The Broader Commercial Portfolio
Beyond Once Upon A Farm, Garner’s commercial activity follows a consistent pattern: long-term brand relationships rather than one-off endorsements.
She has been the recurring face of Capital One’s advertising campaigns, continuing through 2026. She brokered Once Upon A Farm’s first sports sponsorship in 2024 — a multi-year deal making it Angel City FC’s exclusive children’s snack partner.
She was named to the Forbes 50 Over 50 class of 2026 at age 54, alongside continued acting work.
What This Means for the Global Market in 2027
Coverage of celebrity businesses stops at the launch. Here is what actually determines outcomes.
Public listing is the real test of a celebrity brand. Private valuations are negotiated; public ones are voted on daily. Expect more celebrity-founded consumer companies to attempt listings after this precedent — and expect most to trade below their debut.
Governance disclosure becomes the differentiator. Once Upon A Farm published its founder compensation structure. Investors evaluating the next celebrity IPO should ask for the same and treat its absence as a signal.
Tariff exposure is the underpriced risk in food CPG. Companies sourcing produce from Mexico and South America face input volatility that margin models built in a stable trade environment do not capture.
The PBC structure will be tested. A public benefit corporation’s mission commitments have not yet been stress-tested against a sustained share price decline. Once Upon A Farm may become the case study.
Acquisition remains the likely endgame. If the Hedgeye thesis holds, a strategic buyer eventually acquires the brand. The question for shareholders is whether that happens above or below the $18 listing price.
Frequently Asked Questions
What company did Jennifer Garner found?
Garner is a co-founder and chief brand officer of Once Upon A Farm, an organic children’s food company. She joined in September 2017 alongside CEO John Foraker; the business was originally founded by Cassandra Curtis and Ari Raz.
When did Once Upon A Farm go public?
The company listed on the New York Stock Exchange under the ticker OFRM on 6 February 2026, pricing at $18 per share for a valuation of $724 million and raising $197.9 million.
How much revenue does Once Upon A Farm generate?
The company reported $225 million in annual revenue for the year ending September 2025, representing growth of more than 40% year-on-year and a compound annual growth rate above 60% since 2018.
Is Jennifer Garner paid by Once Upon A Farm?
Yes, and the terms are disclosed. She was paid $1 million in the year before the IPO, with $2 million to $3 million in expected annual compensation through 2028, separate from stock options and an IPO-linked bonus.
Discover more from The Monitor
Subscribe to get the latest posts sent to your email.

Legal Pioneer and Defender of Justice: The Life, Works, and Legacy of Navi Pillay

Inside the Modern Republican Party Platform: Tax Policy, Immigration, and Governance

Anne Carson: Genius of Hybrid Forms and 2026 Nobel Laureate in Literature

Analyzing the Republican Voter Enthusiasm Gap: Turnout Metrics and Polling Data

The West Wing Legacy: Why the Political Drama Is More Relevant Than Ever

Remembering Kianna Underwood: The Nickelodeon Actress Behind “All That” and “Little Bill”

Min Ah: The Global Impact and Rising Popularity of the K-Drama Star

Pakistan Warns UN Security Council of AI Risks to Global Peace and Equality

Fortress Diplomacy: How China’s Secretive Hongqi N701 Matches America’s Legendary “Beast”

Best iPhone 18 Pro Max Cases: Premium Protection for Apple’s 2026 Flagship
Pakistan Warns UN Security Council of AI Risks to Global Peace and Equality

Bloodhound Q50: Remembering the Tragic Loss of Chicago’s Rising Drill Star

Remembering Eliana Moreno: The Legacy of NBC LA’s “Eli in the Heli”

Horror Box Office Economics: ROI, Market Share and the 2026

iOS 27 Release Date & Siri AI: The Ultimate Tech News Guide for iPhone 18 Users

Club América’s Financial Playbook: The Economics and Valuation of Latin American Football
Min Ah: The Global Impact and Rising Popularity of the K-Drama Star
Fortress Diplomacy: How China’s Secretive Hongqi N701 Matches America’s Legendary “Beast”
-

 Featured5 years ago
The Right-Wing Politics in United States & The Capitol Hill Mayhem
-

 News5 years ago
Prioritizing health & education most effective way to improve socio-economic status: President
-

 China5 years ago
Coronavirus Pandemic and Global Response
-

 Canada5 years ago
Socio-Economic Implications of Canadian Border Closure With U.S
-

 Democracy5 years ago
Missing You! SPSC
-

 Conflict5 years ago
Kashmir Lockdown, UNGA & Thereafter
-
Democracy5 years ago
President Dr Arif Alvi Confers Civil Awards on Independence Day
-

 Digital6 years ago
Pakistan Moves Closer to Train One Million Youth with Digital Skills