Economy
The Memory Paradox: Why Micron’s Record Earnings Signal Both Triumph and Turbulence Ahead
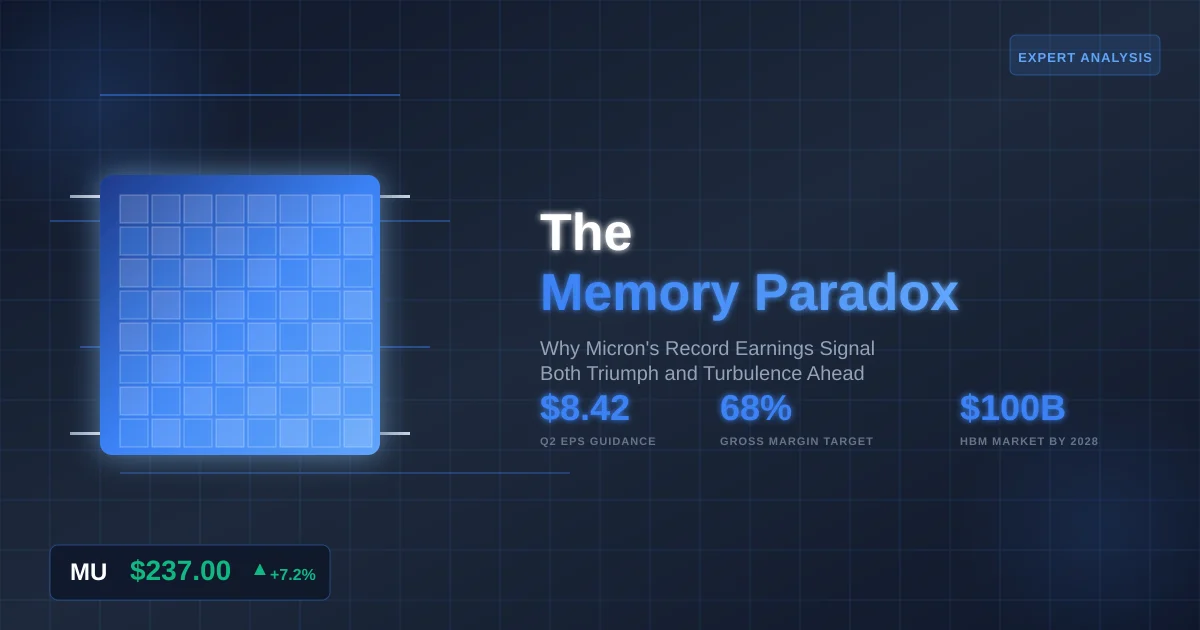
An in-depth analysis of Micron earnings, market positioning, and investment implications amid the AI memory supercycle
When Micron Technology reported fiscal Q1 2026 revenue of $13.64 billion—up from $8.71 billion a year earlier—Wall Street erupted in celebration. The MU stock price surged over 7% in after-hours trading, and analysts scrambled to raise price targets toward the $300 mark. Yet beneath this narrative of triumph lies a more complex reality that investors would be wise to confront: Micron’s extraordinary success may be engineering its own correction.
The semiconductor memory market has entered what industry observers call a “supercycle,” but unlike past boom-bust cycles driven by generic demand, this surge is powered by artificial intelligence’s insatiable appetite for high-bandwidth memory. The question facing investors today isn’t whether Micron can execute—Wednesday’s results proved it can—but whether the economics of this AI-driven expansion can sustain valuations that price in perfection indefinitely.
Table of Contents
The Spectacular Present: Decoding Record Results
Micron delivered adjusted earnings of $4.78 per share in Q1, crushing analyst estimates of $3.95, while guiding for an even more astonishing Q2 forecast: $18.70 billion in revenue and $8.42 adjusted EPS, substantially exceeding expectations of $14.20 billion and $4.78 per share. These aren’t incremental beats—they represent fundamental shifts in pricing power and product mix.
The gross margin trajectory tells the real story. Micron’s gross margin reached 56.8%, up from 45.7% the prior quarter, with guidance for 68% next quarter. This margin expansion eclipses anything seen during previous memory cycles and reflects something genuinely new: the premium that AI infrastructure commands over commodity computing.
Three factors drive this margin euphoria. First, high-bandwidth memory (HBM) now carries pricing power that traditional DRAM never enjoyed. Twelve-layer HBM4 chips fetch approximately $500 each, compared with roughly $300 for HBM3e, while commodity server DRAM struggles to command double-digit premiums. Second, Micron has finalized price and volume agreements for its entire 2026 HBM supply, creating unprecedented revenue visibility. Third, the company is reallocating capacity from low-margin legacy products—witness its exit from the Crucial consumer business—to focus on AI-centric memory where margins approach software-like levels.
Operating cash flow surged to $8.41 billion versus $3.24 billion a year earlier, generating what management called its highest-ever quarterly free cash flow. This isn’t financial engineering—it’s the monetary manifestation of a market structure that has shifted decisively in suppliers’ favor.
The Macro Framework: Supply Discipline Meets AI Urgency
To understand where Micron’s earnings trajectory leads, we must grasp the unprecedented supply-demand imbalance reshaping memory markets. DRAM contract prices rose approximately 16% month-on-month for certain configurations in Q4 2025, while HBM sales are projected to more than double from $15.2 billion in 2024 to $32.6 billion in 2026.
This isn’t your father’s memory cycle. Traditional DRAM markets followed predictable patterns: oversupply triggered price collapses, manufacturers curtailed capacity, scarcity drove recovery, and the cycle repeated. Today’s dynamics differ fundamentally because AI workloads create a step-function increase in memory intensity per compute unit. An AI training cluster requires exponentially more memory bandwidth than traditional servers, and inference workloads—while less demanding—still dwarf conventional computing in memory requirements.
Micron forecasts the HBM total addressable market will reach $100 billion by 2028, accelerated by two years from prior projections, with approximately 40% compound annual growth through 2028. The company projects both DRAM and NAND industry bit shipments will increase around 20% in calendar 2026, yet manufacturers remain supply-constrained because SK Hynix has already booked its entire memory chip capacity for 2026.
Federal Reserve monetary policy adds another dimension. With the Fed having lowered rates to 3.75%, the cost of capital for semiconductor equipment investment has eased, yet manufacturers are exercising unusual capital discipline. Micron raised fiscal 2026 CapEx guidance to $20 billion from $18 billion, but this increase targets specific HBM and advanced DRAM nodes rather than broad capacity expansion. The industry learned from prior cycles that flooding markets destroys value faster than factories can be built.
The memory sector’s consolidated structure—dominated by Samsung, SK Hynix, and Micron—enables coordinated restraint absent from previous eras. When three suppliers control 90% of advanced memory production, the temptation to chase market share through ruinous pricing diminishes. This oligopolistic discipline may prove the most durable structural change supporting today’s Micron stock price.
The Memory Paradox
Why Micron’s Record Earnings Signal Both Triumph and Turbulence Ahead
The Geopolitical Chessboard: When Subsidies Meet Strategy
Micron’s earnings narrative cannot be separated from Washington’s industrial policy ambitions. The company announced plans to invest approximately $200 billion in U.S. semiconductor manufacturing and R&D, supported by up to $6.4 billion in CHIPS Act direct funding for facilities in Idaho, New York, and Virginia. This represents America’s most aggressive attempt to reshore memory chip production since the industry’s inception.
Yet government largesse creates its own complications. The Commerce Department aims to grow U.S. advanced memory manufacturing share from less than 2% today to approximately 10% by 2035—an ambitious goal that requires sustained execution across two decades. The Idaho facilities target leading-edge DRAM and advanced HBM packaging capabilities, while the Virginia expansion focuses on legacy nodes serving automotive and defense markets.
Here’s the uncomfortable truth rarely voiced in earnings calls: government-subsidized capacity expansion, however strategically necessary, ultimately increases global supply in a business where supply-demand balance determines profitability. The CHIPS Act seeks to reduce geopolitical risk by diversifying production away from Taiwan and South Korea, but physics doesn’t care about national security—a wafer produced in Boise generates the same supply pressure as one from Seoul.
China’s exclusion from advanced memory markets adds another wrinkle. While Chinese restrictions reduce Micron’s addressable market, they also eliminate a potential source of low-cost competitive supply. Beijing’s efforts to develop indigenous memory capabilities, including investments exceeding $200 billion, may eventually challenge incumbent suppliers, but technological complexity and equipment restrictions suggest any threat remains years away.
The true test of CHIPS Act economics arrives when these subsidized fabs reach production around 2028-2030. Will market demand absorb this new capacity at today’s elevated prices? Or will the combination of normalized AI infrastructure buildout and increased supply trigger the kind of correction that historically follows memory boom cycles?
The Valuation Verdict: Pricing Perfection in an Imperfect World
With MU stock trading around $237 following Wednesday’s results—up 168% in 2025—valuation has become the central investment question. The current price implies a forward P/E ratio near 14 based on fiscal 2026 analyst estimates clustering around $16-17 per share. In isolation, this appears reasonable for a company guiding toward 68% gross margins.
Yet memory companies historically trade at compressed multiples precisely because their earnings volatility exceeds most sectors. Micron’s trailing results show why: the company reported earnings of $8.54 billion in fiscal 2025, an increase of 997.56% from the prior year. When earnings can surge tenfold in twelve months, they can also collapse with similar velocity.
Three valuation scenarios deserve consideration:
The Bull Case ($300+ target): AI memory demand proves durable through 2027, HBM4 transitions maintain pricing power, and Micron captures 30-35% of a $100 billion HBM market by 2028. Gross margins stabilize above 60%, generating $25+ per share in earnings power. At 15-18x peak earnings, this justifies $375-450 valuations. Multiple analysts including Needham, Wedbush, and Morgan Stanley have embraced versions of this thesis with $300+ price targets.
The Base Case ($225-250 range): Current pricing and margins persist through 2026 before moderating in 2027 as U.S. and Chinese capacity additions begin affecting supply-demand balance. Micron sustains 50-55% gross margins longer-term, supporting $12-15 per share normalized earnings. At 15-17x, this implies $180-255 fair value, suggesting current prices fairly reflect realistic expectations.
The Bear Case ($150-180 range): Memory oversupply emerges by late 2026 as HBM4 ramps across multiple suppliers and AI infrastructure buildout moderates. Contract pricing flexibility, currently favoring suppliers, shifts back toward buyers as multi-year agreements expire. Gross margins compress toward 40-45%—still healthy by historical standards—generating $8-10 per share earnings. At 15-18x trough multiples, this suggests $120-180 valuations.
My probability-weighted assessment assigns 20% likelihood to the bull scenario, 50% to the base case, and 30% to the bear case, yielding an expected value around $210—modestly below current trading levels. This isn’t a screaming sell, but it counsels against aggressive accumulation at prices that embed little room for disappointment.
The Insight Competitors Miss: Memory as Strategic Leverage
Wall Street’s obsession with quarterly beats and margin expansion misses the deeper transformation occurring in semiconductor value chains. Memory has evolved from commodity input to strategic bottleneck, fundamentally altering power dynamics between chip designers, systems integrators, and memory suppliers.
Consider NVIDIA’s position. The company’s AI accelerators command extraordinary gross margins exceeding 70%, yet their performance depends entirely on memory bandwidth. All 2026 HBM price and volume agreements are finalized, meaning NVIDIA and its customers cannot negotiate better terms regardless of market power. This represents a profound reversal: memory suppliers now constrain AI infrastructure expansion rather than passively responding to it.
This dynamic explains why Micron stock price appreciation has actually lagged the fundamental improvement in business economics. Memory companies historically traded as price-takers in commodity markets; today they function as gatekeepers to AI capabilities. The market hasn’t fully priced this transition because investors remember the last four decades of memory market pain—and assume reversion to mean is inevitable.
Yet structural forces suggest this cycle may persist longer than skeptics expect. The manufacturing complexity of HBM—stacking twelve or more DRAM dies with through-silicon vias and advanced packaging—creates formidable barriers to entry. Chinese suppliers will eventually develop HBM capability, but the combination of process technology requirements, equipment restrictions, and years of accumulated manufacturing learning means 2028-2029 represents the earliest credible competitive threat.
Memory has become the new oil: essential, temporarily constrained, and increasingly weaponized by geopolitics. Unlike oil, however, memory cannot be stockpiled indefinitely, and technological transitions (HBM3E to HBM4) require continuous investment in leading-edge manufacturing. This creates a treadmill effect where suppliers must run constantly just to maintain position, limiting the profit pool even during apparent boom times.
Investment Implications: Who Should Own MU Stock Today?
The Micron earnings report crystallizes a fundamental tension: exceptional execution delivering record results, yet priced at levels offering limited margin of safety. This suggests a nuanced approach rather than binary buy/sell recommendations.
Appropriate for: Investors who believe AI infrastructure spending sustains current trajectories through 2027, can tolerate 30-40% drawdowns inherent to semiconductor equities, and view 12-18 month horizons as sufficient. MU stock offers leveraged exposure to AI memory demand without the valuation extremes of companies like NVIDIA trading at 30-40x forward earnings.
Inappropriate for: Conservative portfolios requiring stable income, investors unable to weather cyclical volatility, or those who believe AI capital expenditure cycles will peak in 2026. Memory stocks remain fundamentally cyclical regardless of current margin structures, and no amount of structural improvement eliminates this reality.
What to watch over the next 6-12 months:
- HBM pricing trajectory: Any signs of double-digit HBM price declines projected for 2026 materializing earlier would challenge the bull thesis
- AI infrastructure spending: Hyperscaler capital expenditure guidance for 2026, particularly from Microsoft, Amazon, and Google
- Chinese memory progress: CXMT and other domestic suppliers advancing HBM capabilities faster than expected
- Micron’s capital allocation: Whether the company maintains $20 billion CapEx levels or increases investment in response to demand, potentially oversupplying markets by 2027-2028
Final Verdict: Respect the Execution, Question the Valuation
Micron Technology deserves credit for operational excellence that transformed a commodity producer into a strategic AI enabler. Management navigated the transition from memory oversupply to undersupply with remarkable discipline, positioning the company for its strongest financial period in history.
Yet operational excellence and investment attractiveness diverge when current prices embed assumptions requiring perfection. Micron shares rose over 7% in extended trading on Wednesday, extending 2025 gains that already exceeded 168%. At these levels, investors are pricing not just HBM success, but sustained gross margins above 60%, uninterrupted AI demand growth, and Chinese competitive failures—simultaneously.
Markets have been wrong before when forecasting semiconductor corrections. The current memory supercycle may indeed prove more durable than historical precedent suggests, sustained by AI’s genuinely transformative computing requirements. But betting against mean reversion in memory markets requires extraordinary conviction that this time truly differs from past cycles.
The prudent course recognizes both possibilities. For existing holders, consider reducing positions to lock in gains while maintaining core exposure to potential upside. For new buyers, patience likely offers better entry points as inevitable volatility creates opportunities. And for everyone: respect Micron’s execution while maintaining healthy skepticism about valuations that price in several years of flawless performance.
The memory paradox persists: Micron has never been stronger operationally, yet that very strength may contain the seeds of eventual normalization. In semiconductor investing, recognizing this tension separates durable returns from painful lessons in cyclical dynamics.
FAQ: Critical Questions for Micron Investors
Q: Will AI replace or enhance Micron’s market position?
A: AI fundamentally enhances Micron’s strategic position by creating unprecedented demand for high-bandwidth memory. Unlike previous technology transitions that commoditized memory, AI workloads require specialized HBM that commands premium pricing and creates structural supply constraints. The risk isn’t AI replacing memory demand—it’s whether AI infrastructure spending moderates before new capacity arrives.
Q: How sustainable are 60%+ gross margins for a memory company?
A: Historical context suggests caution. Micron’s margins peaked at 60-65% during the 2017-2018 supercycle before collapsing to 20-30% by 2019. Current margins reflect genuine HBM premium pricing and favorable product mix, but memory economics eventually self-correct through capacity additions and pricing negotiations. Margins above 50% sustained beyond 2026 would be unprecedented, requiring continuous technological transitions maintaining supplier pricing power.
Q: Is the CHIPS Act investment bullish or bearish for MU stock?
A: Both simultaneously. Near-term, government subsidies reduce Micron’s capital burden and create barriers for foreign competitors. Long-term, subsidized U.S. capacity expansion increases global supply in markets where supply-demand balance determines profitability. The investment is unambiguously positive for U.S. economic security but introduces complexity for Micron shareholders depending on supply-demand balance when new fabs reach production around 2028-2030.
Q: What’s the biggest risk to Micron’s current valuation?
A: Not Chinese competition or technology disruption, but rather the timing mismatch between AI infrastructure spending cycles and memory supply additions. If hyperscaler CapEx moderates in 2026-2027 while Micron, Samsung, and SK Hynix simultaneously increase HBM output, the resulting supply-demand rebalancing could compress margins rapidly. Memory markets move from shortage to glut faster than most investors anticipate—the same urgency driving today’s pricing power becomes tomorrow’s overcapacity.
The author holds no position in Micron Technology (MU) or related securities. This analysis represents informed opinion based on publicly available information and should not constitute investment advice. Readers should conduct independent research and consult financial advisors before making investment decisions.
Discover more from The Monitor
Subscribe to get the latest posts sent to your email.


Federal student loan defaults are climbing sharply once more, with new data showing millions of borrowers slipping into default status as the last remnants of pandemic-era protections disappear. The numbers paint a troubling picture for household finances at a moment when many Americans are already grappling with elevated borrowing costs.
Table of Contents
The Numbers Behind the Surge
According to the Federal Reserve Bank of New York, roughly 2.6 million additional federal student loan borrowers had their loans transferred to the Department of Education’s Default Resolution Group during the first quarter of 2026 alone. That follows roughly 1 million defaults recorded in late 2025, suggesting the pace of new defaults is accelerating rather than leveling off.
A Liberty Street Economics analysis tied to the data found that the average newly defaulted borrower is nearly 39 years old — notably not a young, recent graduate, but someone further along in their career. Many of these borrowers were current on their loans before the pandemic-era payment pause began back in 2020, underscoring how disruptive the return to normal repayment has been even for previously reliable borrowers.
The Credit Score Hit
The financial damage extends well beyond the loans themselves. Borrowers who default see their credit scores drop by an average of 91 points — a steep decline that can affect everything from their ability to rent an apartment to the interest rates they’re offered on car loans, credit cards, and mortgages going forward.
Collections Are Paused — For Now
There is a temporary reprieve: collections on defaulted federal student loans are currently paused. But that pause is not guaranteed to last. Once collections resume, affected borrowers could face wage garnishment, seizure of tax refunds, and offsets against federal benefits — consequences that could compound an already difficult financial position for millions of households.
A Broader Affordability Squeeze
The default wave is unfolding alongside other affordability pressures. Mortgage rates have moved sharply higher in recent weeks, with the 30-year fixed rate climbing to 6.92% for the week ending May 22, up from 6.71% just two weeks earlier. That increase has pushed a growing share of buyers toward adjustable-rate mortgages, which carry lower introductory rates but reset based on future market conditions — a trade-off that could create fresh financial strain if rates remain elevated.
What It Means for Borrowers
For the millions of borrowers now in default, the message from financial experts is consistent: defaulting on a federal student loan carries serious, long-lasting consequences, and the current pause on collections should be treated as a window to seek resolution options rather than a reason for complacency.
Discover more from The Monitor
Subscribe to get the latest posts sent to your email.
Analysis
Indonesia’s Danantara Shifts to Investment Phase, Targets 7% Returns — Sovereign Wealth Fund Enters Deployment Era Under Prabowo’s Ambitious Vision

The morning light over Jakarta’s financial district has a way of making ambition look achievable. In the gleaming corridors of the Danantara Indonesia headquarters — a building that barely existed eighteen months ago — a quiet but consequential shift is underway. The sovereign wealth fund that President Prabowo Subianto unveiled with enormous fanfare in February 2025 has spent its inaugural year doing something unglamorous but essential: building the institutional scaffolding that separates a serious fund from a political showpiece. Now, as Indonesia’s Danantara sovereign wealth fund enters its investment phase in 2026, the real examination begins.
At the World Economic Forum in Davos in January, Chief Investment Officer Pandu Patria Sjahrir declared that Danantara’s target for investment fund placements in 2026 is set at $14 billion — nearly double the $8 billion allocated across all of 2025. Kompas The capital acceleration is not simply a number; it is a declaration of intent. The governance year is over. The deployment year has arrived.
Table of Contents
Year One: The Governance Foundation Nobody Talks About
Before you can deploy capital at scale, you need systems that can be trusted with it. That is the unglamorous lesson Danantara absorbed in 2025. Chief executive Rosan Roeslani acknowledged that a primary achievement of the first year was breaking down the siloed operations that had long plagued Indonesia’s state-owned enterprises, promoting greater transparency and internal value creation. Jakarta Globe
BCA Chief Economist David Sumual confirmed the picture candidly: Danantara’s main focus in 2025 was internal consolidation — restructuring efforts, organizational improvements, and recruitment of human resources — with no major projects having fully materialized by year’s end despite SOE dividends being reallocated to the fund. Indonesia Business Post
That candour from a senior domestic economist is actually a constructive signal. Unlike the opaque early years of Abu Dhabi’s IPIC or the dangerously undisclosed operations of Malaysia’s 1MDB before its collapse, Danantara’s leaders are at least publicly acknowledging the gap between aspiration and execution. The first year served as a necessary stress-test of internal architecture. The critical question, now that the architecture is nominally in place, is whether the deployment year delivers the returns its political patron is demanding.
The 7% Return Mandate: Prabowo’s Public Challenge
Few sovereign wealth fund leaders have their performance targets set quite so publicly — or quite so politically — as Pandu Sjahrir now does. President Prabowo Subianto has publicly set a target of 7% return on assets for the fund, a mandate that Sjahrir acknowledged directly, saying Danantara would gladly accept the challenge as it “searches for projects that can give higher returns with the same impact while improving standards.” Jakarta Globe
The 7% ROA hurdle deserves context. Indonesia’s current state-owned enterprise portfolio has historically generated returns on assets hovering near 1.88% — a figure that reflects decades of sub-optimal capital allocation, political interference in pricing decisions, and chronic underinvestment in productivity. Reaching 7% is not an incremental improvement. It represents nearly a fourfold leap in capital efficiency across a portfolio of more than 1,000 SOEs.
To understand whether the target is reachable, consider how the world’s benchmark sovereign funds perform. Singapore’s Temasek Holdings has delivered annualised total shareholder return of approximately 7% in Singapore dollar terms over its 50-year history — but this was achieved with an entirely different governance architecture, strict commercial independence from government policy directives, and a portfolio heavily weighted toward liquid, globally diversified assets. GIC, Singapore’s other sovereign vehicle, targets real returns above 4% over 20-year rolling periods while managing over $770 billion. Abu Dhabi’s Mubadala, a closer model given its hybrid development-investment mandate, has generated returns in the 8–12% range in its best years, but only after a decade of portfolio maturation and institutional discipline-building.
What Danantara needs — quickly — is a portfolio mix that can bridge the gap between its politically derived SOE inheritance and the commercially rational returns its mandate demands.
Shifting to Deployment: Bonds, Equities, and the Capital Market Play
In a presentation at the Indonesia Stock Exchange, Pandu Sjahrir confirmed that Danantara would begin investing SOE dividend capital in both bonds and equities through the capital market starting in 2026, with the explicit additional goal of deepening Indonesia’s relatively shallow domestic capital markets. Kompas
This two-pronged strategy is tactically sound. Fixed-income instruments — particularly Indonesian government bonds (SBN) and SOE-issued corporate bonds — offer predictable yields in the 6–7% range at current rupiah interest rate levels, immediately competitive with the ROA target. The equities component introduces both upside potential and volatility, but also provides the market liquidity and price-discovery function that Indonesia’s IDX has lacked for years.
Economic observer Yanuar Rizky assessed that Danantara’s entry as a major institutional investor could have a positive stabilising effect on Indonesia’s capital markets, provided the fund maintains a clear distinction between commercial portfolio investment and politically motivated market support operations. Kompas That caveat is pointed. If Danantara begins purchasing equities to prop up falling SOE stock prices rather than to generate returns, it will quickly become both a market distortion mechanism and a fiscal liability.
Danantara is also considering taking a shareholder position in the Indonesia Stock Exchange itself through its demutualization process — a move that would simultaneously give the fund a structural role in market governance while diversifying its asset base into financial infrastructure. Kompas
The $14 Billion Deployment Pipeline: Sectors and Scale
The capital earmarked for 2026 will flow primarily from SOE dividends and will target sectors including renewable energy, energy transition, digital infrastructure, healthcare, and food security. Danantara is also evaluating opportunities beyond Indonesia’s borders — specifically in China, India, Japan, South Korea, and Europe — though domestic allocation remains the dominant priority. Asia Asset Management
Six major projects were scheduled for groundbreaking in February 2026 alone, including an aluminum smelter and smelter-grade alumina facility in Mempawah, West Kalimantan; a bioavtur production facility at the Cilacap Refinery in Central Java; a bioethanol plant in Banyuwangi, East Java; and salt factories in Gresik and Sampang designed to supply Indonesia’s chlor-alkali industrial base. Kompas Together, these projects form the visible edge of what Danantara describes as a $7 billion downstream industrialization push — Indonesia’s long-deferred attempt to stop exporting raw nickel, bauxite, and palm oil and start exporting processed value.
The downstream story matters enormously for return-on-assets arithmetic. A nickel laterite operation generates modest margins; a battery cathode facility or EV component manufacturer attached to that same ore base can generate returns in the 12–18% range at commercial scale. That is the logic threading through Danantara’s investment thesis — and it is the same logic that has made Indonesia’s nickel-to-battery downstream push a subject of intense interest among Japanese, South Korean, and European manufacturers watching their supply chains with growing anxiety.
CEO Rosan Roeslani has emphasized that 2026’s strategy is built on risk-managed deployment and long-horizon value creation, with investment screens tightened to ensure capital flows only to projects with clear commercial merit and measurable economic impact. GovMedia
Danantara vs. The World’s Great Sovereign Funds: A Benchmark Comparison
| Fund | AUM (approx.) | 10-Year Return | Independence Model | Primary Focus |
|---|---|---|---|---|
| Norway GPFG | $1.7 trillion | ~8.5% p.a. | Statutory independence | Global equities/bonds |
| Temasek (Singapore) | ~$300 billion | ~7% TSR | Operational independence | Asia equities |
| GIC (Singapore) | ~$770 billion | 4%+ real | Full professional management | Global diversified |
| Mubadala (Abu Dhabi) | ~$300 billion | 8–12% (peak) | Semi-commercial | Strategic/development |
| Khazanah (Malaysia) | ~$35 billion | Mixed | Political proximity | Domestic SOEs |
| Danantara (Indonesia) | ~$900 billion AUM | Target: 7% ROA | Political appointment-led | SOEs + strategic projects |
The table tells a revealing story. Danantara is already one of the largest sovereign vehicles on earth by nominal AUM — but AUM and investable capital are very different things when the underlying portfolio consists largely of SOE assets that are neither liquid nor independently valued. Norway’s Government Pension Fund Global can credibly report 8.5% annualised returns because its portfolio is marked to liquid global market prices daily. Danantara’s SOE assets are carried at book values that may significantly diverge from what arms-length buyers would actually pay.
This is not a fatal flaw — it is a governance design choice with profound implications for how the 7% target gets measured. If Danantara measures ROA against re-valued, market-based asset prices, the benchmark is genuinely demanding. If it measures against legacy book values, the headline number may look better while concealing underlying performance deterioration.
The Broader Economic Stakes: Indonesia’s Path Past the Middle-Income Trap
Danantara does not exist in isolation. It is the financial architecture beneath President Prabowo’s “Golden Indonesia 2045” vision — the aspiration to reach developed-nation status within a generation. The fund was explicitly designed to help accelerate the president’s target of 8% annual GDP growth by his term’s end in 2029, consolidating and streamlining SOE operations to unlock productivity gains that fragmented management had suppressed for decades. Fortune
Indonesia’s GDP per capita, currently around $5,000, needs to triple to reach developed-world thresholds. That requires sustained, compounding productivity improvements across agriculture, manufacturing, energy, and services simultaneously. Danantara — if it functions as designed — could accelerate this by directing capital toward infrastructure gaps, energy transition assets, and downstream industries that private markets have been too cautious or too short-sighted to finance at the required scale.
Prabowo’s pitch to American business leaders in Washington in February 2026 was explicit: all state-owned assets have been consolidated under Danantara to accelerate investment, and the fund will serve as a primary engine of Indonesia’s economic transformation. Jakarta Globe The geopolitical subtext was equally clear — Indonesia is positioning itself as a destination for capital diversifying away from Chinese concentration and seeking access to Southeast Asia’s 280 million-strong consumer middle class.
Pandu Sjahrir, speaking at the South China Morning Post’s China Conference: Southeast Asia 2026 in Jakarta in February, framed the geopolitical dimension directly: “In the new geopolitical world, every country and every leader uses sovereign wealth funds as a geopolitical tool,” while insisting that Danantara must operate for profit rather than politics. South China Morning Post The tension between those two imperatives — geopolitical instrument and commercially disciplined investor — defines Danantara’s central challenge, and is one that even mature funds like Mubadala have never fully resolved.
Risks, Scrutiny, and the 1MDB Shadow
No serious analysis of Danantara can avoid the governance concerns that have trailed the fund from its inception. Following Danantara’s inauguration, the Jakarta Composite Index fell 7.1%, driven by continuous foreign capital outflows of approximately $622.7 million — a market verdict on investor discomfort with the fund’s legal structure and oversight architecture. East Asia Forum
The concerns are structural, not merely perceptual. Indonesia’s national audit bodies — the Financial Audit Board (BPK), the Agency for Financial and Development Supervision (BPKP), and the Corruption Eradication Commission (KPK) — have limited ability to monitor Danantara’s managed assets. Audits can only be conducted upon request from the House of Representatives, creating an oversight model that is reactive rather than systematic. Wikipedia
Critics have pointed out that Danantara’s senior leadership emerged from political negotiation as much as merit selection — CEO Rosan Roeslani served as Prabowo’s campaign chief, while Pandu Sjahrir served as the campaign’s deputy treasurer. East Asia Forum These connections do not automatically disqualify either man — Temasek’s own senior officials maintain government proximity — but they demand an unusually clear demonstration of commercial independence before institutional investors will commit capital with confidence.
Economists have also flagged crowding-out risks: as Danantara absorbs SOE dividends and raises capital through bond instruments, private sector investment appetite may be compressed, particularly if Patriot Bond subscriptions divert capital that listed companies would otherwise have deployed for their own growth. Indonesia Business Post
The Patriot Bond programme itself has attracted commentary that is difficult to ignore. Financial analysts widely viewed the initiative — which raised over Rp50 trillion from Indonesia’s business elite — as carrying the implicit return of political goodwill rather than purely financial reward, describing it as a “loyalty test” for the nation’s conglomerates. Wikipedia These are not conditions under which a world-class sovereign fund typically operates.
Investor Outlook: What Global Capital Should Watch
For international investors, Danantara’s deployment year presents a calibrated opportunity set rather than a binary bet. The fund’s entry into Indonesia’s bond and equity markets will provide liquidity and potentially improve price discovery on SOE-linked assets that have historically been thinly traded. Indonesia’s sovereign bond yields — currently in the 6.8–7.2% range for 10-year instruments — already offer competitive real returns given the country’s current inflation trajectory, and Danantara’s institutional demand will provide additional market support.
The downstream projects represent a longer-dated opportunity. Investors with three-to-five-year horizons who gain exposure to Indonesia’s nickel-to-battery value chain — whether through listed SOEs, joint venture structures, or Danantara-linked project bonds — are positioning for a structural shift in global clean-energy supply chains. The risk is not the economics of the projects themselves; it is the execution timeline and the political discipline to resist using Danantara as a budget-substitute during fiscal pressures.
Danantara’s 2026 Corporate Work Plan, presented to the House of Representatives, emphasised that every investment must be “bankable and truly value-accretive” — a standard borrowed from the private equity lexicon that, if genuinely applied, would represent a meaningful departure from the historically political character of Indonesian SOE capital allocation. Danantara Indonesia
Whether that departure is real or rhetorical will become clear within the next eighteen months. The projects are breaking ground. The bonds are being issued. The capital is beginning to flow. And in a country of 280 million people sitting atop some of the world’s most valuable commodity and consumer market assets, the upside — if governance holds — is not 7%. It is considerably higher.
Prabowo’s fund has set the floor. The ceiling is a function of institutional integrity.
Conclusion: The Deployment Era Begins — And the Scrutiny Deepens
Indonesia’s Danantara sovereign wealth fund enters 2026 at an inflection point that will define its legacy for a generation. The governance infrastructure is nominally in place. The capital pipeline — $14 billion targeted for deployment this year — is the largest in the fund’s short history. The 7% return-on-assets mandate, set publicly by the president himself, is ambitious relative to current SOE performance baselines but achievable if capital is deployed into commercial-grade projects with rigorous discipline.
The fund’s peer group — Temasek, GIC, Mubadala, Norway’s GPFG — took years, sometimes decades, to earn the institutional credibility that translates into sustained performance. Danantara does not have that luxury of time. Indonesia’s growth aspirations are set on a compressed timeline, and the political expectations attached to this fund are enormous.
What sophisticated investors should watch: the actual returns posted in Danantara’s first audited annual report; the independence and credibility of whichever oversight mechanism emerges; the performance of the six downstream projects currently breaking ground; and whether the fund’s capital market activities in bonds and equities reflect commercial logic or political stabilization.
The fund carrying the weight of Indonesia’s Golden 2045 vision is now, at last, actively deploying. The test of whether Danantara becomes Southeast Asia’s defining sovereign fund — or its most cautionary tale — begins today.
Discover more from The Monitor
Subscribe to get the latest posts sent to your email.

A single misread ship position sent oil markets through a psychological threshold. What it reveals about the fragility wired into global energy supply chains — and why $100 crude may now be the floor, not the ceiling.
By the time New York trading desks were reaching for a second coffee, Brent crude for May delivery had quietly crossed a number that carries outsized psychological weight in commodity markets: one hundred dollars per barrel. At 10:55 a.m. CDT (15:55 GMT), the benchmark stood at $101.83, up $1.37 or 1.36% on the session and on course for a weekly advance. U.S. West Texas Intermediate for April trailed in its wake at $96.26, adding 53 cents, or 0.55%, and likewise pointing to a positive close for the week.
The proximate catalyst was, on its face, almost comedically narrow: a misreading of the navigational position of a single Indian-flagged oil tanker — the Jag Prakash — carrying gasoline bound for Africa. An Indian government official had indicated the vessel was transiting through the Strait of Hormuz, triggering an immediate spike in risk premiums. Within the hour, that account was corrected: the Jag Prakash was, in fact, moving east of the strait, well within the Gulf of Oman, on a route that had never taken it through the chokepoint at all.
Yet Brent held its gains. And that, more than any individual data point, tells you precisely where the global oil market stands in the spring of 2026.
Table of Contents
The Geopolitical Kindling Beneath Every Price Tick
To understand why a single tanker’s GPS coordinates could move a benchmark priced across millions of barrels, you first need to understand what the market is already pricing. The Strait of Hormuz — the narrow passage between Iran and Oman through which roughly 21 million barrels per day flow, representing approximately 20% of global oil trade and one-third of globally traded liquefied natural gas — is not, at this moment, operationally closed. But it is conceptually contested in ways not seen since the tanker wars of the late 1980s.
The escalating U.S.-Israeli military posture toward Iran, following the multilateral strikes on Iranian nuclear infrastructure that defined the first quarter of 2026, has permanently altered how shipping insurers, freight brokers, and portfolio managers assess passage risk through the Gulf. War-risk insurance premiums for Hormuz-transiting vessels have risen sharply since January, according to market participants familiar with Lloyd’s of London pricing. Iranian naval exercises near Abu Musa island have added operational uncertainty. Every tanker departure from Ras Tanura and Kharg Island now carries a geopolitical footnote.
In this environment, the market’s hair-trigger sensitivity to anything resembling a confirmed Hormuz incident is entirely rational — and almost certainly permanent for as long as the current Iranian standoff remains unresolved.
Market Reaction and the Psychology of $100
The $100 threshold for Brent crude is not merely arithmetical. It is behavioral. Crossing it triggers algorithmic buying programmes, resets inflation expectations in central bank models, and — critically — shifts the language of corporate earnings calls, central bank minutes, and finance ministry briefings from “elevated energy costs” to “oil shock.” The semantics matter because they change policy.
“One hundred dollars is where the macro conversation changes,” a senior European macro strategist noted in a client note circulated Thursday. “Below it, energy is a headwind. Above it, energy becomes the story.”
Real-time market data as of the session snapshot:
- Brent May futures: $101.83 (+1.36%)
- WTI April futures: $96.26 (+0.55%)
- Weekly trajectory: Both benchmarks on course for positive weekly close
- Brent premium to WTI: ~$5.57 — widened from the 2025 average of ~$4.10, reflecting elevated Hormuz/Middle East risk embedded in waterborne crude
The WTI-Brent spread’s expansion is itself analytically significant. It suggests the market is not simply pricing a generalised demand impulse — U.S. domestic fundamentals remain broadly stable — but rather a specific maritime and geopolitical risk premium attached to Middle Eastern waterborne crude, precisely the grades most at risk from any Hormuz disruption.
The Jag Prakash Correction — What Actually Happened
The Jag Prakash is an India-flagged product tanker operating in the broader Gulf of Oman and Indian Ocean trade corridor. On Friday morning, an Indian government official communicated that the vessel — carrying a cargo of gasoline (motor spirit) bound for Africa — was in motion near the Strait of Hormuz. The phrase “near the Strait of Hormuz” was initially interpreted by wire services and trading desks alike as implying passage through the strait itself, which would have represented the first confirmed unescorted commercial transit of a vessel carrying hydrocarbons through the waterway since Iranian naval harassment incidents in February.
Within approximately 45 minutes, a corrected statement clarified that the tanker was operating east of the strait, in the Gulf of Oman, on a route that bypasses the chokepoint entirely. The vessel had not transited the Strait of Hormuz. It was — and remained — on a conventional eastward trade arc.
The episode is a case study in information velocity and market fragility. It took less than an hour for a navigational miscommunication to push a globally traded commodity benchmark through a psychologically significant price level. It took the same amount of time for the correction to fail to bring prices back down.
That asymmetry — sharp spikes on bad news, sticky prices on corrections — is the defining characteristic of a market trading in a state of persistent latent anxiety.
Economic Ripple Effects: India, Asia, and the Inflation Transmission Chain
For India specifically, the episode carries layered significance that transcends a single tanker’s position. India is now the world’s third-largest oil importer, having surpassed Japan, and its import bill is denominated overwhelmingly in U.S. dollars against a rupee that remains sensitive to current-account deterioration. Every sustained $10/bbl increase in Brent crude adds approximately $12–14 billion annually to India’s import bill at current consumption volumes, according to estimates consistent with Ministry of Petroleum modelling frameworks.
The Jag Prakash incident, and the broader sensitivity it reveals, matters to New Delhi for three reasons. First, Indian refiners — including Indian Oil Corporation, Bharat Petroleum, and Hindustan Petroleum — have aggressively expanded their purchase of discounted Russian Urals crude since 2022, partly to insulate the country from Middle Eastern supply disruptions. But Russian crude still flows through waters adjacent to Iran’s sphere of influence, and a genuine Hormuz closure would reshape global tanker routing in ways that affect even non-Hormuz cargoes through port congestion and freight-rate contagion.
Second, India’s downstream product exports — including the Jag Prakash‘s gasoline cargo destined for Africa — are a growing source of foreign exchange earnings. Disruption to product tanker routes depresses those margins. Third, and most structurally: India’s inflation dynamics are acutely oil-sensitive. The Reserve Bank of India’s rate-setting calculus is already complicated by food price volatility; a sustained Brent price above $100 would likely delay any easing cycle and sustain borrowing costs for an economy that badly needs cheaper capital.
Across the broader Asian importers — Japan, South Korea, Taiwan, Bangladesh, Pakistan — the calculus is similarly unfavourable. These economies collectively import over 20 million barrels per day, and unlike the United States, they have no meaningful domestic production buffer. Asian energy security anxiety, already elevated after the 2022 gas crisis in Europe, would intensify sharply if Hormuz were genuinely disrupted.
What Happens Next: Analyst Outlook and Strategic Implications
The immediate consensus from energy analysts is that the Jag Prakash correction removes the specific trigger for Friday’s move but does nothing to remove the underlying conditions that made markets so reactive in the first place. Several dynamics are worth watching in the coming weeks:
- Iranian naval posturing: Tehran has limited but real ability to complicate Hormuz transits without formally closing the strait — harassment, shadow tanker tactics, drone surveillance of flagged vessels. Any escalation in this grey zone will maintain the risk premium.
- OPEC+ supply discipline: The cartel’s current production agreement has kept supply deliberately tight. There is no indication that Saudi Arabia or the UAE is prepared to unilaterally release capacity to offset geopolitical risk premiums — indeed, Riyadh benefits from prices above $90/bbl for budget equilibrium.
- U.S. strategic petroleum reserve posture: Washington drew the SPR to historic lows in 2022–23 and has only partially replenished it. Deploying it again as a political tool faces both physical constraints and credibility costs.
- Shipping insurance: Lloyd’s and the broader war-risk market may begin pricing Hormuz transits as structurally elevated regardless of day-to-day incident data, effectively building a permanent premium into Middle Eastern crude.
Implications for Global Markets
The Jag Prakash episode will be remembered — if at all — as a footnote in the oil market’s 2026 narrative. The correction came quickly, and no cargo was disrupted, no vessel was damaged. But its significance lies precisely in the speed and magnitude of the market’s initial reaction, and in the stubbornness of prices even after the facts were clarified.
We are operating in an oil market structurally priced for disruption. The geopolitical architecture that underwrote the relative stability of Hormuz transits for four decades — U.S. naval predominance, Iranian diplomatic containment, and the tacit mutual interest of all parties in preserving commercial flows — is under greater stress today than at any point since the tanker war era. That stress is now reflected not just in forward curves and options skew but in the market’s neurological response time to ambiguous information.
For central banks in Frankfurt, London, Delhi, and Tokyo, the message is uncomfortable but unambiguous: $100 Brent is not a crisis. It is, for now, the new normal. The question is not whether energy prices will complicate monetary policy — they already are — but how long policymakers can sustain the fiction that supply-side geopolitical shocks are “transient” in a world where the transit chokepoints themselves have become contested terrain.
For corporate treasurers at airlines, petrochemical firms, and shipping conglomerates, the practical implications are already arriving in hedging desks and procurement contracts. For governments in net-importing economies — and there are far more of those than net exporters — the fiscal arithmetic is tightening with every week that Brent holds above the century mark.
The Jag Prakash was east of Hormuz all along. But the anxiety that read its position otherwise is not going anywhere.
Discover more from The Monitor
Subscribe to get the latest posts sent to your email.

Asia Pacific Emerges as Global Travel Growth Engine — China Outbound to Surpass 225 Million Trips

The AI Debt Bubble: How Data Centers Are Reshaping Credit Markets

AI Chip War 2026: How Singapore & Malaysia Got Caught Between US and China

Indonesian Rupiah 2026: Why Bank Indonesia Can’t Stop the Currency’s Slide

Fed Rate Hike 2026: Kevin Warsh’s Hawkish Pivot Explained | Impact on Mortgages & Markets

The New Disorder at Sea: How the Iran War Exposed the Limits of American Maritime Power

The G7’s Fragile Consensus: Why Europe Is Right to Fear Trump’s Return to Ukraine Negotiations

Cyprus Tourism Revenue Plunges 33.8% in March as Israeli Arrivals Dry Up

Student Loan Defaults Surge Again as Pandemic-Era Protections Fade Into Memory
AI Chip War 2026: How Singapore & Malaysia Got Caught Between US and China
The AI Debt Bubble: How Data Centers Are Reshaping Credit Markets
The G7’s Fragile Consensus: Why Europe Is Right to Fear Trump’s Return to Ukraine Negotiations
Fed Rate Hike 2026: Kevin Warsh’s Hawkish Pivot Explained | Impact on Mortgages & Markets
Indonesian Rupiah 2026: Why Bank Indonesia Can’t Stop the Currency’s Slide
Cyprus Tourism Revenue Plunges 33.8% in March as Israeli Arrivals Dry Up
Asia Pacific Emerges as Global Travel Growth Engine — China Outbound to Surpass 225 Million Trips
The New Disorder at Sea: How the Iran War Exposed the Limits of American Maritime Power
-

 Featured5 years ago
The Right-Wing Politics in United States & The Capitol Hill Mayhem
-

 News4 years ago
Prioritizing health & education most effective way to improve socio-economic status: President
-

 China5 years ago
Coronavirus Pandemic and Global Response
-

 Canada5 years ago
Socio-Economic Implications of Canadian Border Closure With U.S
-

 Democracy5 years ago
Missing You! SPSC
-

 Conflict5 years ago
Kashmir Lockdown, UNGA & Thereafter
-
Democracy5 years ago
President Dr Arif Alvi Confers Civil Awards on Independence Day
-

 Digital5 years ago
Pakistan Moves Closer to Train One Million Youth with Digital Skills