
Analysis
American Corporate Profits Keep Shrugging Off Global Tumult — Earnings Expectations Are Through the Roof


In markets, narratives can matter as much as hard data. Investors make decisions based on the stories they tell one another. Over the past seven weeks the tales being swapped have been of war in Iran, its effect on global energy markets and presidential social-media activity. The S&P 500, America’s benchmark index of stocks, has moved up and down with Donald Trump’s estimates of the odds of an end to the conflict. It surged to an all-time high on April 17th as America and Iran agreed to let traffic resume in the Strait of Hormuz. It dipped on April 20th after the deal collapsed.
And yet, beneath all of that noise, US corporate earnings in 2026 are doing something remarkable. They are growing — fast, broadly, and with a consistency that embarrasses the pessimists.
Table of Contents
The Numbers That Cut Through the Geopolitical Din
The earnings picture heading into this season was already extraordinary before a single company reported. According to FactSet’s April 17 Earnings Insight, the consensus estimate for Q1 2026 S&P 500 earnings growth stood at 13.2% year-on-year at the start of the quarter — the highest entry-level estimate for any earnings season since Q2 2022. That is not a soft bar. That is a high-jump pole set at altitude.
What happened next was better still. With 10% of S&P 500 companies reporting actual results as of April 17th, 88% beat EPS estimates — well above the five-year average of 78% and the ten-year average of 76%. The magnitude of those beats was equally striking: companies are reporting earnings 10.8% above estimates, against a five-year average surprise rate of just 7.3%.
This is the sixth consecutive quarter of double-digit year-on-year earnings growth for the index. Six consecutive quarters. The S&P 500 hit a record intraday high of 7,126.06 on April 17th. That is not a coincidence.
A War, a Waterway, and the Market’s Cold Arithmetic
The Strait of Hormuz has been effectively closed since early March, cutting off roughly 20% of global oil supply — what the International Energy Agency has called the largest energy supply disruption in the history of global markets. More than 500 million barrels of crude and condensate have been removed from the market, according to Kpler data. U.S. crude oil closed at $89.61 per barrel on April 20th after jumping 6.8% when the ceasefire unraveled. Brent settled at $95.48, up 5.6% on the day.
Iran declared the strait open on a Friday. Oil prices tumbled more than 10%. The S&P 500 surged. By the following Monday, Trump accused Iran of firing on a French ship, seized an Iranian vessel, and the deal was functionally dead. Stocks barely flinched, falling just 0.2%.
That asymmetric response is the most important data point of this earnings season — and nobody is talking about it enough. When peace breaks out, markets rally hard. When war resumes, markets shrug. That is not resilience born of confidence. It is resilience born of a very specific market bet: that American corporate profits have been insulated from the mayhem.
So far, that bet is paying off. But the reasons why demand closer inspection.
The Magnificent Few and the Hidden Concentration Risk
Goldman Sachs raised its year-end S&P 500 target to 7,600 in early April, citing 12% earnings growth and a broad recovery — but its own analysts immediately flagged a problem with that framing. As Goldman’s equity strategy team noted, consensus estimates for 2026 and 2027 are about 4% above January levels, but the improvement is not evenly distributed. Exxon Mobil and Micron Technology account for a disproportionate share of upward revisions, while the median S&P 500 company has seen little or no change to its 2026 earnings outlook.
This is a market that looks healthier at the index level than it does underneath. FactSet’s breakdown makes the concentration explicit: the Magnificent 7 are projected to deliver 22.8% earnings growth in Q1 2026. The remaining 493 companies are projected to deliver 10.1%. Strip out NVIDIA alone, and the Magnificent 7 growth rate collapses to 6.4% — lower than the broader market.
That is a meaningful distinction for any portfolio manager choosing between chasing the benchmark and staying selective. The headline number flatters the underlying reality.
Q1 2026 Sector Earnings Growth: Who Is Carrying the Load
The sector-level breakdown, per FactSet and IG’s Q1 earnings preview, tells a more nuanced story than the aggregate suggests.
| Sector | Q1 2026 Estimated YoY EPS Growth |
|---|---|
| Information Technology | +45.0% |
| Materials | +24.2% |
| Financials | +15.1% (blended: +19.7%) |
| Consumer Discretionary | ~+12.0% |
| Industrials | ~+10.0% |
| Communication Services | Flat to slight growth |
| Utilities | ~+5.0% |
| Real Estate | ~+3.0% |
| Consumer Staples | ~+2.0% |
| Energy | -0.1% (volatile) |
| Health Care | -9.8% (Merck charge; ex-Merck: +2.8%) |
The Financials sector has been the early season standout. JPMorgan Chase reported $5.94 EPS against a $5.47 estimate. Citigroup delivered $3.06 versus $2.65. Bank of America and Morgan Stanley both beat. The blended Financials growth rate jumped from 15.0% to 19.7% in a single week of reporting.
Energy, meanwhile, is the cautionary tale embedded in this table. The sector’s estimated earnings growth swung from +12.9% in early April to -0.1% by mid-month, driven almost entirely by downward revisions to ExxonMobil’s guidance. The average Q1 oil price of $72.67 per barrel was only 1.8% above Q1 2025’s $71.38 average — the Q1 price spike only materialized late in the quarter, too late to flow through to most upstream earnings.
The Contrarian Case: Strength Built on Sand
Here is the uncomfortable truth that the bull narrative glosses over: US corporate profits are not resilient because American companies are exceptionally strong. They are resilient because they have exceptional pricing power — and because AI capital expenditure is creating an accounting illusion of demand.
Consider the mechanics. Technology companies are reporting earnings that are overwhelmingly driven by AI infrastructure spending. The firms writing the checks — hyperscalers, cloud providers, semiconductor companies — are booking revenues that appear as organic demand growth but are substantially circular: one tech giant’s AI capex becomes another’s top line. NVIDIA’s extraordinary contribution to S&P 500 growth (it is the single largest contributor for both Q1 2026 and full-year 2026 per FactSet) reflects an investment supercycle, not end-market demand expansion.
Meanwhile, the companies not in the AI supply chain — the median S&P 500 firm, the one Goldman says has seen no earnings revision — are passing higher energy and input costs onto consumers. That is pricing power. It is real. It has kept margins intact. But it is not growth in the classical sense. It is inflation in corporate clothing.
The IMF warned this week that global growth will take a hit even if the ceasefire holds, citing persistent energy disruption as a drag on output and a source of renewed inflation. “It’s clear we’re not going back to the Goldilocks scenario,” said Brian Arcese of Foord Asset Management. Investors who mistake pricing-power resilience for genuine economic strength will discover the difference when consumers, finally stretched too thin by elevated energy costs, stop absorbing the increases.
What the Forward Guidance Will Reveal
The real test of this earnings season is not Q1 — it is what companies say about Q2, Q3, and Q4. Most of Q1’s business activity predates the Hormuz closure, which only became a severe supply disruption in March. The damage in transportation costs, energy inputs, and supply-chain friction will show up in Q2 guidance calls, not Q1 actuals.
Analysts are currently forecasting earnings growth of 20.1%, 22.2%, and 19.9% for Q2 through Q4 2026 respectively. The full-year 2026 consensus sits at 18.0% growth. Those are staggering expectations for an economy operating under the largest energy supply disruption in modern history. A single round of conservative guidance from the major industrials — logistics companies, airlines, manufacturers — could puncture them quickly.
The market is already signaling some unease. According to FactSet’s April 17 update, companies reporting positive Q1 earnings surprises have actually seen an average price decrease of 0.2% in the two days following their reports. The market is saying: we already priced this in. Show us what comes next.
The Narrative Premium and Its Limits
There is a concept worth naming here: the “narrative premium.” It is the excess valuation that accrues to markets when the dominant story — in this case, AI-driven earnings supercycle plus geopolitical resolution — outpaces the underlying data. The forward 12-month P/E ratio for the S&P 500 stands at 20.9, above both the five-year average of 19.9 and the ten-year average of 18.9. Since March 31st, the price of the index has risen 7.6% while forward EPS estimates have risen just 1.5%. That gap is narrative premium, not fundamental re-rating.
Narrative premiums can persist for a long time. They can also collapse with remarkable speed when a single data point — an unexpected miss on forward guidance, an oil price shock that does not reverse — forces a reassessment of the story.
The S&P 500 hit an all-time record on April 17th. American profits are, genuinely, impressive. The earnings season is, genuinely, strong. But investors who are treating current valuations as justified by fundamentals — rather than supported by narrative — are carrying a risk they may not have fully priced.
The Strait of Hormuz is still closed. Thirteen million barrels a day are still locked out of global markets. And Q2 guidance calls start this week.
Frequently Asked Questions
What is driving US corporate earnings growth in 2026?
US corporate earnings growth in 2026 is being driven primarily by the Information Technology sector, which is projected to report 45% year-on-year EPS growth in Q1, largely due to AI infrastructure investment and semiconductor demand led by NVIDIA. Financial sector earnings have also significantly outperformed, with major banks including JPMorgan Chase, Citigroup, and Bank of America all beating Q1 estimates. The broader S&P 500 is on track for its sixth consecutive quarter of double-digit earnings growth, with analysts forecasting 18% full-year 2026 growth according to FactSet data.
How has the Iran war and Strait of Hormuz closure affected S&P 500 stocks?
The S&P 500 has shown surprising resilience despite the Strait of Hormuz being effectively closed since early March 2026, representing the largest energy supply disruption in modern history per the IEA. The index hit a record intraday high of 7,126.06 on April 17th when a brief ceasefire opened the waterway, then fell only 0.2% on April 20th when the deal collapsed. Energy sector earnings have been volatile — projected growth swung from +12.9% to -0.1% in two weeks — but the tech and financials sectors have more than offset the disruption at the index level.
Are S&P 500 earnings expectations too high for 2026?
Analysts are currently forecasting 18% full-year earnings growth for the S&P 500 in 2026, with Q2 through Q4 estimates ranging from 20.1% to 22.2%. These figures are historically elevated and carry substantial downside risk from Q2 forward guidance, given that most Q1 business activity predated the Hormuz supply disruption. The forward P/E ratio of 20.9 — above both the five- and ten-year averages — reflects a significant narrative premium tied to AI investment and geopolitical resolution expectations. A single round of conservative guidance from industrial or energy companies could materially revise these expectations lower.
Discover more from The Monitor
Subscribe to get the latest posts sent to your email.




Global growth has proved harder to derail than many feared, but resilience is no longer evenly distributed. The IMF’s October 2026 World Economic Outlook projects 3.1% global real GDP growth this year and 3.4% in 2027. It also expects inflation to reach 4.7% in 2026 before easing to 4.1% next year. Those figures describe an expanding world economy, not a global recession. They also conceal a widening divide between technology-linked investment hubs and energy-importing developing countries.
The danger is not simply a weaker headline growth rate. It is that governments may respond to an uneven shock with blunt policy instruments: indiscriminate energy subsidies, abrupt fiscal austerity or interest-rate changes that neglect currency and inflation risks. The next phase of economic resilience will be determined by the quality of those choices.
Key takeaways
- Positive global growth masks divergent conditions across countries and industries.
- The AI investment cycle supports output but increases concentration and valuation risk.
- Energy prices transfer purchasing power from importers to producers and complicate monetary policy.
- High public debt makes apparently affordable short-term interventions expensive over time.
- For Pakistan and other import-dependent economies, targeted relief and durable export capacity are more valuable than headline stimulus.
The number that both reassures and misleads
The IMF’s 3.1% projection indicates that world output is still expanding in real terms. But an average cannot describe who bears the costs. A country hosting semiconductor investment may register a manufacturing upswing while an importing economy faces a higher fuel bill and constrained fiscal choices. Similarly, a profitable multinational can raise capital for data centres even when smaller firms struggle with borrowing costs.
The contrast also appears between different statistical frameworks. The UN Department of Economic and Social Affairs’ mid-2026 update forecast 2.5% global growth for 2026. That was a forecast published in May, using different assumptions and an earlier information set. It is not appropriate to present it as a contradiction that was settled by averaging the two figures. Readers should compare release dates, definitions and data cutoffs before drawing conclusions.
The October IMF forecast was prepared with statistical information available through October 1, according to the report. Even a recently published forecast cannot fully price in an unexpected military escalation or market shock afterward. Economic forecasts are conditional pictures of a changing landscape, not guarantees.
Three asymmetries shaping the world economy
Growth is concentrated in particular technologies
The WTO’s October trade update lifted its forecast of merchandise trade-volume growth to 3.9% for 2026, compared with 1.9% in March. Demand for AI-enabling goods helped offset disruptions in fuel and fertilizer trade. That is not a general statement that every exporter is thriving. It suggests that the composition of trade matters more than the direction of the global average.
The investment picture is similarly uneven. UNCTAD’s World Investment Report 2026 records a 6% rise in global foreign direct investment to $1.6 trillion in 2025, but says the recovery was concentrated. The 20 largest recipient economies attracted more than 80% of global inflows. A rebound in aggregate investment can coexist with a shortage of long-term capital where it is most needed.
Inflation hurts people and economies differently
Inflation is not one event experienced at the same intensity by everyone. A richer household may postpone a nonessential purchase; a lower-income household cannot postpone the need to eat or commute. An exporting fuel producer can benefit from a price spike while a developing economy paying for imported diesel loses foreign exchange and confronts an increase in domestic transport costs.
This distributional difference is precisely why the IMF’s 2026 World Economic Outlook places emphasis on temporary, targeted support during cost-of-living crises. The institution’s analysis finds that suppressing prices broadly can require several times the fiscal resources of targeted transfers. The political attraction of a universal subsidy is understandable; the budgetary opportunity cost can be punishing.
Financial resilience is not safety
The October Global Financial Stability Report warns about a possible correction in AI-related assets, rising sovereign yields and cyber incidents affecting financial infrastructure. Markets can remain calm for a long period while leverage, maturity mismatches or fiscal vulnerabilities accumulate underneath.
This distinction matters for sovereign borrowers. A government can refinance debt readily during a period of abundant risk appetite and then face sharply higher yields when investors reassess inflation or fiscal credibility. For an economy with substantial external obligations, volatility in international funding conditions can affect both public finances and private investment.
The economic transmission chain
| External shock | First transmission channel | Second-round consequence | Policy trade-off |
|---|---|---|---|
| Oil or diesel supply disruption | Import and freight costs rise | Inflation and weaker real incomes | Relief versus fiscal capacity |
| AI investment disappoints | Technology valuations weaken | Financing and equipment demand soften | Market support versus risk discipline |
| Sovereign yields rise | Debt refinancing costs increase | Less room for productive spending | Consolidation versus development |
| Tariff uncertainty rises | Supply chains and sourcing change | Investment delays and costlier inputs | Resilience versus efficiency |
| Tourism routes disrupted | Passenger flows and service earnings shift | Job and foreign-exchange losses | Security versus connectivity |
Original analytical framework; effects vary by country and timing.
A policymaker who sees only the first-round consequence may reach for the wrong remedy. A sudden oil price increase, for example, is not identical to excessive domestic demand. Higher interest rates can dampen inflation expectations and protect currency confidence, but they cannot create additional diesel. Conversely, a large untargeted subsidy may hide the visible rise in fuel prices while worsening public borrowing needs.
Why fiscal policy has become the decisive constraint
Governments entered this period with limited buffers. The IMF’s April 2026 Fiscal Monitor put global public debt at just under 94% of GDP in 2025 and projected it would reach 100% by 2029. An October IMF assessment of sovereign yields stressed that higher interest rates amplify fiscal pressure when debt is already elevated.
These are global debt measures, not a claim that every country shares the same balance-sheet risk. A reserve-currency government issuing long-term debt in its own money is in a different position from a frontier market with foreign-currency maturities. A sensible debt debate should therefore examine interest costs, maturity profiles, contingent liabilities and the credibility of future tax revenue—not debt-to-GDP in isolation.
A second question is the composition of fiscal adjustment. Cutting productive maintenance, basic education or disease prevention may improve a year’s reported deficit while damaging the economy’s long-run earning capacity. Credible consolidation should focus on inefficient spending and revenue leakage while preserving high-return public functions.
Asia and Pakistan: policy through the import bill
Energy-importing Asian economies face a dual challenge: fuel costs can rise as demand from major trading partners changes. Export manufacturing may benefit from stronger global goods trade, but the advantage is reduced when electricity and transport become more expensive. A successful strategy has to work on the export side and the import side together.
Pakistan illustrates the tension. An October 7 IMF statement estimated FY2025–26 real GDP growth at 3.6%, and reported gross reserves of around $21.5 billion at end-September. The Fund reached a staff-level agreement on program reviews, subject to Executive Board approval, not an unconditional disbursement. The statement also stressed energy-sector efficiency, taxation, reserves and targeted safety nets.
For Pakistan the policy logic is sequential. First, preserve macroeconomic credibility so price and exchange-rate signals remain useful. Second, protect vulnerable people with instruments designed around need rather than petrol consumption. Third, reduce energy-system losses and logistics frictions that prevent domestic producers from capitalizing on global trade opportunities. Fourth, raise skills and reliability in sectors capable of earning foreign exchange.
The same logic applies, with different institutional arrangements, to many countries across South Asia and Southeast Asia. A temporary commodity boom should not be mistaken for structural competitiveness; a temporary fuel shock should not become an excuse for permanent distortionary subsidies.
Four choices that cannot be postponed
Choose targeted protection over universal price freezes. Distributional relief should reach people most exposed to higher food, transport and electricity costs. That requires social registries, payment systems and transparent eligibility criteria. When assistance is untargeted, larger consumers often capture more of the financial benefit.
Choose investment quality over investment headlines. Data-centre announcements, industrial incentives and infrastructure projects are not equally valuable. Governments should ask how much domestic employment, export capacity, grid improvement and knowledge transfer each generates after subsidies and public guarantees are counted.
Choose diversified trade over tariff reflexes. Supply-chain resilience sometimes justifies redundant capacity, but permanent protection can also shelter unproductive firms. The relevant test is whether a measure lowers the expected total cost of disruption without becoming an open-ended subsidy to inefficiency.
Choose credible gradual reform over abrupt announcements. A clear medium-term fiscal and monetary path allows firms to plan capital expenditure, wages and hiring. Repeated reversals can raise the risk premium even when the immediate measure appears pro-business.
Risks, limitations and what would change the outlook
The outlook could improve if energy flows normalize, AI investment produces broad productivity gains and trade tensions ease. It could deteriorate if conflict escalates, financing costs rise or investors reassess the expected profitability of AI infrastructure. No single model can assign reliable probabilities to each geopolitical pathway. Differences between IMF and UN growth forecasts also caution against false precision.
The signals to follow are the composition of WTO trade growth; oil-product availability rather than only crude benchmarks; long-term sovereign yields; new FDI projects outside leading recipient countries; and whether real wages improve after inflation. Household welfare is the ultimate test of resilience, not the absence of recession headlines.
Frequently asked questions
Is the global economy in recession in 2026?
The IMF baseline still projects positive world output growth of 3.1% for 2026. Individual economies or sectors may nonetheless contract.
What does resilience under strain mean?
It means overall economic activity continues expanding, but the supporting conditions are increasingly unequal and vulnerable to financial, energy and geopolitical shocks.
Why can global trade grow faster than global GDP?
Trade volumes can be lifted by particular categories—such as AI-related equipment—even when domestic services and consumption in other economies are subdued.
Why are broad fuel subsidies risky?
They can be costly, may benefit larger consumers disproportionately and can reduce funds available for targeted social protection and infrastructure.
Does the IMF’s Pakistan staff-level agreement mean funds have already arrived?
No. Its October 7 announcement explicitly says implementation is conditional on Executive Board approval.
Which measure should households follow?
Real income—income adjusted for inflation—along with reliable employment, transport and food costs provides a more useful picture than global GDP alone.
Conclusion
Resilience is not the ability to ignore danger; it is the capacity to absorb shocks without sacrificing the foundations of future growth. In 2026 the world remains economically active, but benefits are concentrated and buffers are strained. Governments that preserve targeted social support, rebuild fiscal credibility and invest in productivity will emerge stronger than those that mistake a positive growth figure for proof of economic security.
Discover more from The Monitor
Subscribe to get the latest posts sent to your email.

October is Major League Baseball’s postseason month, with the League Championship Series leading toward the World Series. MLB’s official October 9 update listed league championship broadcasting arrangements and said its complete postseason schedule was subject to change. That is the appropriate basis for a service article, rather than relying on viral bracket graphics. Sources: MLB and NBA.
The important context competitors can overlook
The playoff path moves through the Wild Card Series, Division Series, League Championship Series and World Series. Series lengths differ, affecting travel planning, pitching strategies and when a potential deciding game may occur. Weather, broadcast adjustments and series ending early can all change the actual date of a matchup. A guide should therefore distinguish tentative “if necessary” games from guaranteed events. For primary-source checks and current reporting, see MLB and NFL. The key distinction is practical broadcast and bracket explainer with no fictitious results.
October baseball moves through elimination series toward the World Series. Games marked ‘if necessary’ depend on earlier series results. Research cutoff: October 12, 2026; confirm developing facts before publication.
A practical way to use this information
Use MLB’s live bracket and broadcast information for tonight’s specific matchup, while this article provides the enduring format explanation. If publishing a result, record the completed date and source. Viewers should check the network, streaming eligibility and local restrictions before paying. Avoid declaring future participants or game outcomes without an official final score.
What to verify before making a decision
The right next step is to identify the source, timestamp and applicable market or jurisdiction. Check whether a number is a historical observation, official announcement, target, forecast or scenario. If you intend to act financially, legally or commercially, use the relevant provider’s current terms and obtain professional advice where appropriate. The sources cited here establish context; they are not a substitute for live prices, individual eligibility checks or binding agreements.
Reader questions
Where is the authoritative 2026 playoff schedule? MLB publishes and updates it at MLB.com/postseason.
Why are some dates marked if necessary? Best-of-series matchups end once a team wins the required number of games.
How the MLB postseason bracket works
Major League Baseball’s postseason includes division winners and wild-card teams, followed by a sequence of elimination series that eventually determines each league champion and the World Series participants. The rounds use different series lengths; that affects pitching strategy, bullpen workload and how quickly a team can be eliminated. A single-game result in a best-of-series contest is important but not always decisive. Readers should consult MLB’s official postseason hub for the bracket rather than rely on an old graphic that may not reflect completed games.
Home-field advantage, seeding and tiebreaking rules add context to the matchup schedule. Those details can vary by competition edition, so the official rules should be checked instead of recycled from a prior year. When a postseason series has not yet finished, the next opponent remains conditional. An article should say “winner of Series A will face…” rather than assign a future opponent before the result exists.
Why starting pitching changes a short series
Starting pitchers often shape the first half of a game, but playoff success requires bullpen management, defense, baserunning and timely hitting. A team may start its most experienced pitcher in the first game and then adjust the rotation based on rest, health and earlier results. Managers must also decide when to use their strongest relief pitchers. Those choices can matter more in a short series than in a long regular season where roles and workloads can be smoothed across many games.
Baseball statistics need sample-size discipline. A hitter’s performance over ten postseason plate appearances tells less about underlying ability than a much longer period of play. Analysts can compare strikeout rates, on-base production and matchup tendencies while avoiding exaggerated claims drawn from one home run or one defensive error. Recent injuries and announced starting lineups can change the outlook quickly.
Broadcast rights and local time differences
A game carried by a U.S. broadcaster may require a different provider for an international audience. Some streaming services include blackout restrictions and authenticated subscriptions. Before directing readers to a platform, check the league’s official listing for the game, region and date. A schedule can shift because of series outcomes or weather; do not assume every potential Game 6 or Game 7 will occur. Conditional games should be clearly labeled so viewers do not subscribe or travel based on a nonexistent fixture.
Fans outside North America should verify dates carefully. A game beginning late at night in U.S. Eastern Time can appear on the following morning in Pakistan or elsewhere. A credible global article uses time-zone labeling and, where practical, provides local conversions while directing readers to official confirmations.
Planning a trip to a postseason game
Buy tickets through the team’s verified ticket office or a recognized authorized resale route. Read what happens to a ticket for an “if necessary” game that is never played. Lodging and transportation may be nonrefundable even when the ticket itself is refunded under a particular policy. Stadium entry rules, bag restrictions and transport can vary by venue. Travel budgets should include potential schedule shifts, especially when the identity of the next opponent is not yet known.
Reseller offers that look dramatically cheaper than the going rate can be fraudulent. Confirm seat location, transfer method and the platform’s buyer-protection terms. Never assume an image of a barcode sent by a stranger proves a usable ticket. The simplest defense is to purchase through verified channels and retain the order record.
A bracket-tracking method that stays accurate
For each series, maintain the teams, seeds, current games-won tally, next confirmed game time, probable or announced starters, broadcaster and a direct MLB link. Update each row only after official results. Distinguish “clinched” from “leads series.” If a matchup concludes earlier than its maximum length, remove unused dates or mark them canceled; otherwise a static editorial calendar can appear inaccurate within hours.
The purpose of a postseason guide is not to predict every winner. It is to make a fast-moving bracket understandable and give fans reliable answers on what happens next, where to watch and which details remain uncertain.
Baseball postseason questions answered
Does every potential game on a postseason schedule occur?
No. A best-of-seven series ends when one team reaches four wins. Games listed as “if necessary” do not take place if the series has already been decided. Ticket buyers and travelers should understand refund or cancellation policies associated with those conditional dates before arranging flights and hotels.
Why do playoff teams use pitchers differently?
A shorter series changes the cost of saving an elite relief pitcher or spacing starting assignments. Managers may make aggressive substitutions to protect a narrow lead, while maintaining enough arms for a possible next game. Such choices can look different from regular-season strategy, when teams plan around a longer schedule and broader workload management.
Can a postseason match move after its first announcement?
Yes. Broadcast planning, prior series results and circumstances such as weather can affect schedules. MLB’s official game page and league notices should be checked shortly before travel or viewing. An editorial table that fails to update conditional games can easily mislead readers as the bracket advances.
Discover more from The Monitor
Subscribe to get the latest posts sent to your email.
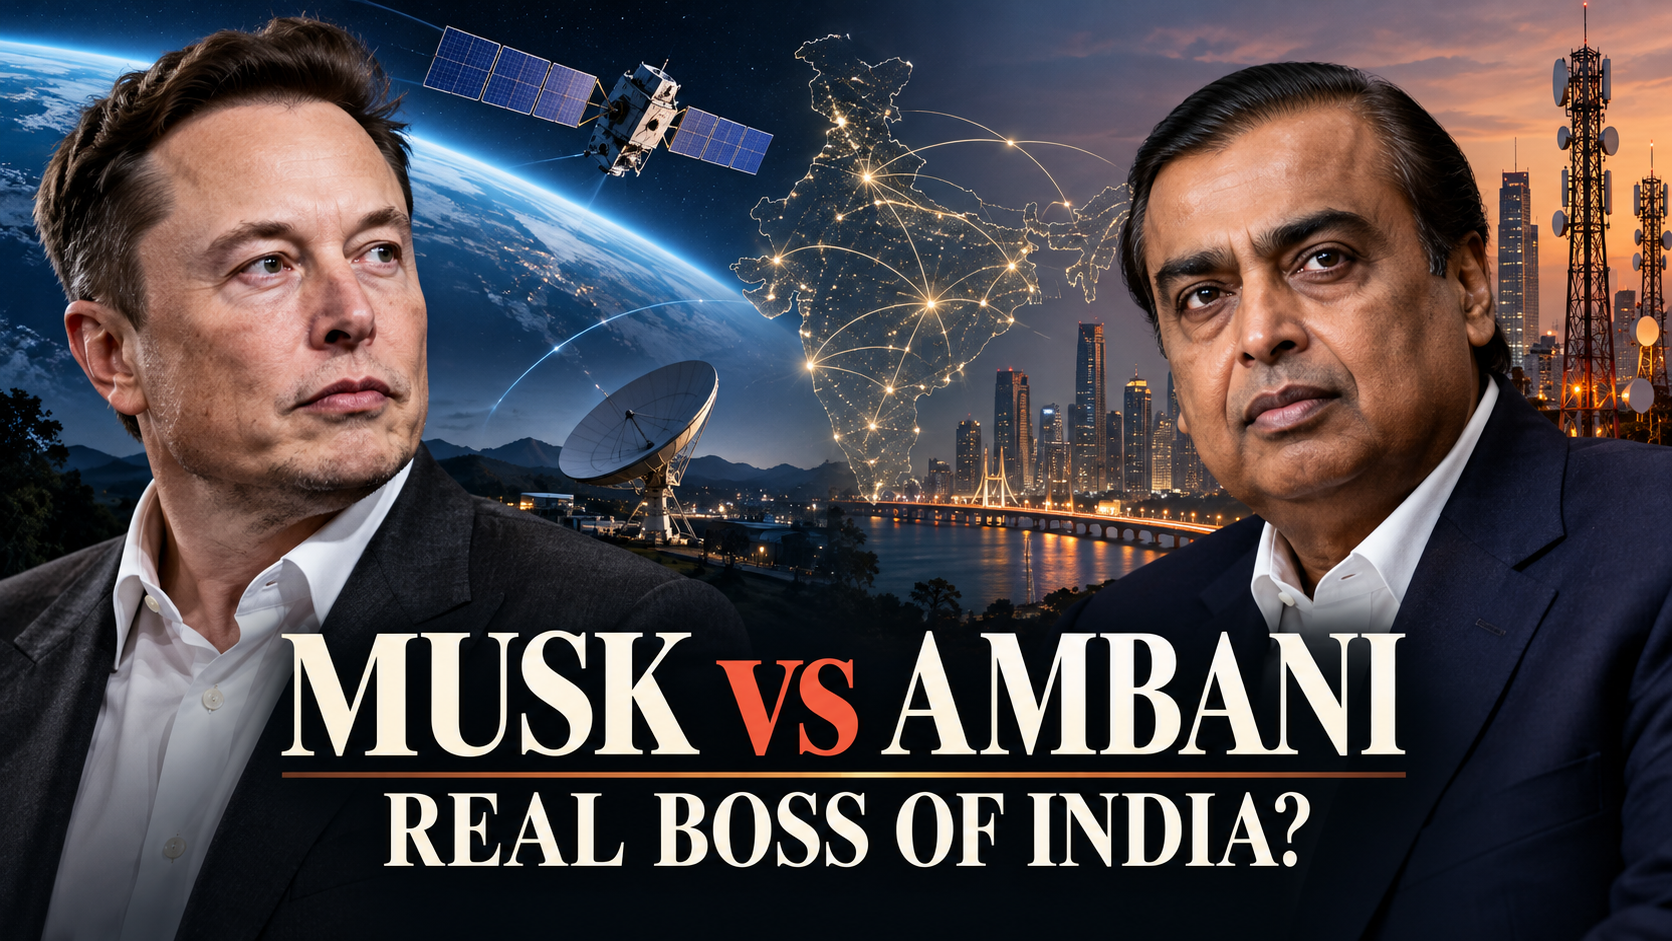
SpaceX CEO Elon Musk has escalated a public dispute over Starlink’s delayed commercial launch in India, sarcastically addressing Reliance Industries Chairman Mukesh Ambani as “Prime Minister Ambani” and questioning whether he holds outsized influence over the country’s telecom landscape. The remarks, posted on X in early October 2026, center on claims that entrenched interests—particularly around Reliance Jio—are slowing satellite broadband approvals to protect market dominance. Indian authorities have rejected the accusations as baseless, emphasizing a uniform regulatory process for all licensed satellite operators. Bloomberg
Musk’s Escalating Posts and Arguments for Starlink
Musk first accused unnamed “oligarchs” of blocking Starlink to maintain a “monopolistic chokehold on the Indian people,” describing the situation as “a crime against the people of India.” He followed by asking, “Is Ambani the real boss of India?” after noting that Starlink is licensed in over 165 countries and has spent five years complying with Indian requirements. In a subsequent post addressed as “Dear Prime Minister Ambani,” he offered a “humble apology” for not recognizing Ambani’s role and urged him to allow competition, arguing that satellite internet could connect underserved areas. Times of India
Musk highlighted potential benefits: improved access for children to education, opportunities for small businesses to reach global markets, and life-saving connectivity during natural disasters when terrestrial networks fail. He later pushed back against critics, stating that competition would benefit Indian consumers with more choices, that Ambani “is not going out of business,” and that Starlink would need affordable pricing to gain traction. Times of India
Government Position: No Monopoly, Uniform Rules for All Licensees
Union Communications Minister Jyotiraditya Scindia has directly addressed the claims, stating that “India does not allow a monopoly in any sector.” He confirmed that three companies hold Global Mobile Personal Communication by Satellite (GMPCS) licences: Starlink, Reliance’s Jio Satellite Communications, and Bharti-backed Eutelsat OneWeb. All three are at a similar regulatory stage and can begin commercial services only after each individually completes security clearances (assessed primarily by the Ministry of Home Affairs) and the government finalizes the revenue-based spectrum charging framework. CNBC TV18
The Department of Telecommunications has described suggestions of discriminatory treatment as “baseless and misconceived.” Security requirements include data localization, lawful interception capabilities, Indian gateways, and related technical demonstrations—conditions that apply equally across licensees. Spectrum assignment is set to be administrative rather than auction-based, with a usage charge of around 5% of adjusted gross revenue (lower for rural/remote areas) nearing finalization with the Telecom Regulatory Authority of India. Business Standard
Starlink’s Approval Timeline and Remaining Hurdles
Starlink received its GMPCS licence from the Department of Telecommunications in June 2025 and IN-SPACe authorization for its Gen-1 constellation in July 2025, following years of engagement that began with an application around November 2022. Provisional spectrum for testing has been available in some cases, but commercial operations require the outstanding security clearances and spectrum assignment. OneWeb and Jio Satellite secured earlier licences but face the same final milestones. Amazon’s Project Kuiper has also expressed interest and is under review. Business Standard
India’s Telecom Landscape and Connectivity Gaps
Reliance Jio remains India’s largest wireless operator, with roughly 500–530 million connections and about 39% market share as of mid-to-late 2026 data, closely trailed by Bharti Airtel at around 38%. Together the two private players dominate the market, with Vodafone Idea and BSNL holding smaller shares. Jio has driven significant growth in 5G adoption and fixed broadband. TelecomLead
Despite high overall coverage, a digital divide persists. TRAI and related data show India with over 1.09 billion internet subscriptions as of early 2026, but rural penetration stands at about 48 subscriptions per 100 people versus roughly 127 in urban areas. Large numbers of people live within mobile broadband footprints yet do not use the internet, with rural-urban gaps remaining notable. Satellite services are positioned by regulators as particularly suited for remote, border, hilly, and island areas that are harder to serve with terrestrial infrastructure. Government programs such as BharatNet continue expanding fiber and mobile coverage in villages. The Policy Edge
Broader Implications
The exchange underscores tensions between global satellite broadband ambitions and national regulatory, security, and competitive frameworks in one of the world’s largest telecom markets. Proponents of faster Starlink entry argue it could accelerate connectivity in hard-to-reach areas and introduce pricing and service competition. Authorities maintain that the process prioritizes security, data protection, and a level playing field among multiple licensed players rather than favoring any single incumbent. As of mid-October 2026, commercial satellite broadband services from any of the three licensees have not yet launched, pending the completion of remaining individual clearances and spectrum finalization.
Musk’s posts have drawn responses from opposition figures, including Rahul Gandhi, but the core dispute remains centered on the pace and nature of regulatory approvals for satellite internet in India. Further clarity is expected once security assessments conclude and the spectrum pricing regime is formally implemented.
Discover more from The Monitor
Subscribe to get the latest posts sent to your email.

Resilience Under Strain: The World’s Difficult 2026 Choices

Andy Harris in 2026: Freedom Caucus Influence, Spending and Congressional Power

MLB Playoffs 2026: Postseason Format, Broadcast Guide and How to Track the Bracket

Elon Musk Calls Mukesh Ambani the “Real Boss of India” Over Alleged Monopoly Concerns

Legal Pioneer and Defender of Justice: The Life, Works, and Legacy of Navi Pillay

Inside the Modern Republican Party Platform: Tax Policy, Immigration, and Governance

Anne Carson: Genius of Hybrid Forms and 2026 Nobel Laureate in Literature

Analyzing the Republican Voter Enthusiasm Gap: Turnout Metrics and Polling Data

The West Wing Legacy: Why the Political Drama Is More Relevant Than Ever

Min Ah: The Global Impact and Rising Popularity of the K-Drama Star
Inside the Modern Republican Party Platform: Tax Policy, Immigration, and Governance
Analyzing the Republican Voter Enthusiasm Gap: Turnout Metrics and Polling Data
Anne Carson: Genius of Hybrid Forms and 2026 Nobel Laureate in Literature

Remembering Kianna Underwood: The Nickelodeon Actress Behind “All That” and “Little Bill”
Elon Musk Calls Mukesh Ambani the “Real Boss of India” Over Alleged Monopoly Concerns
The West Wing Legacy: Why the Political Drama Is More Relevant Than Ever
Andy Harris in 2026: Freedom Caucus Influence, Spending and Congressional Power
MLB Playoffs 2026: Postseason Format, Broadcast Guide and How to Track the Bracket
-

 Featured6 years ago
The Right-Wing Politics in United States & The Capitol Hill Mayhem
-

 News5 years ago
Prioritizing health & education most effective way to improve socio-economic status: President
-

 China5 years ago
Coronavirus Pandemic and Global Response
-

 Democracy5 years ago
Missing You! SPSC
-

 Conflict5 years ago
Kashmir Lockdown, UNGA & Thereafter
-

 Canada5 years ago
Socio-Economic Implications of Canadian Border Closure With U.S
-
Democracy5 years ago
President Dr Arif Alvi Confers Civil Awards on Independence Day
-

 Digital6 years ago
Pakistan Moves Closer to Train One Million Youth with Digital Skills