
US
2026 Midterms: How Democrats Are Competing in Deep-Red Senate Seats

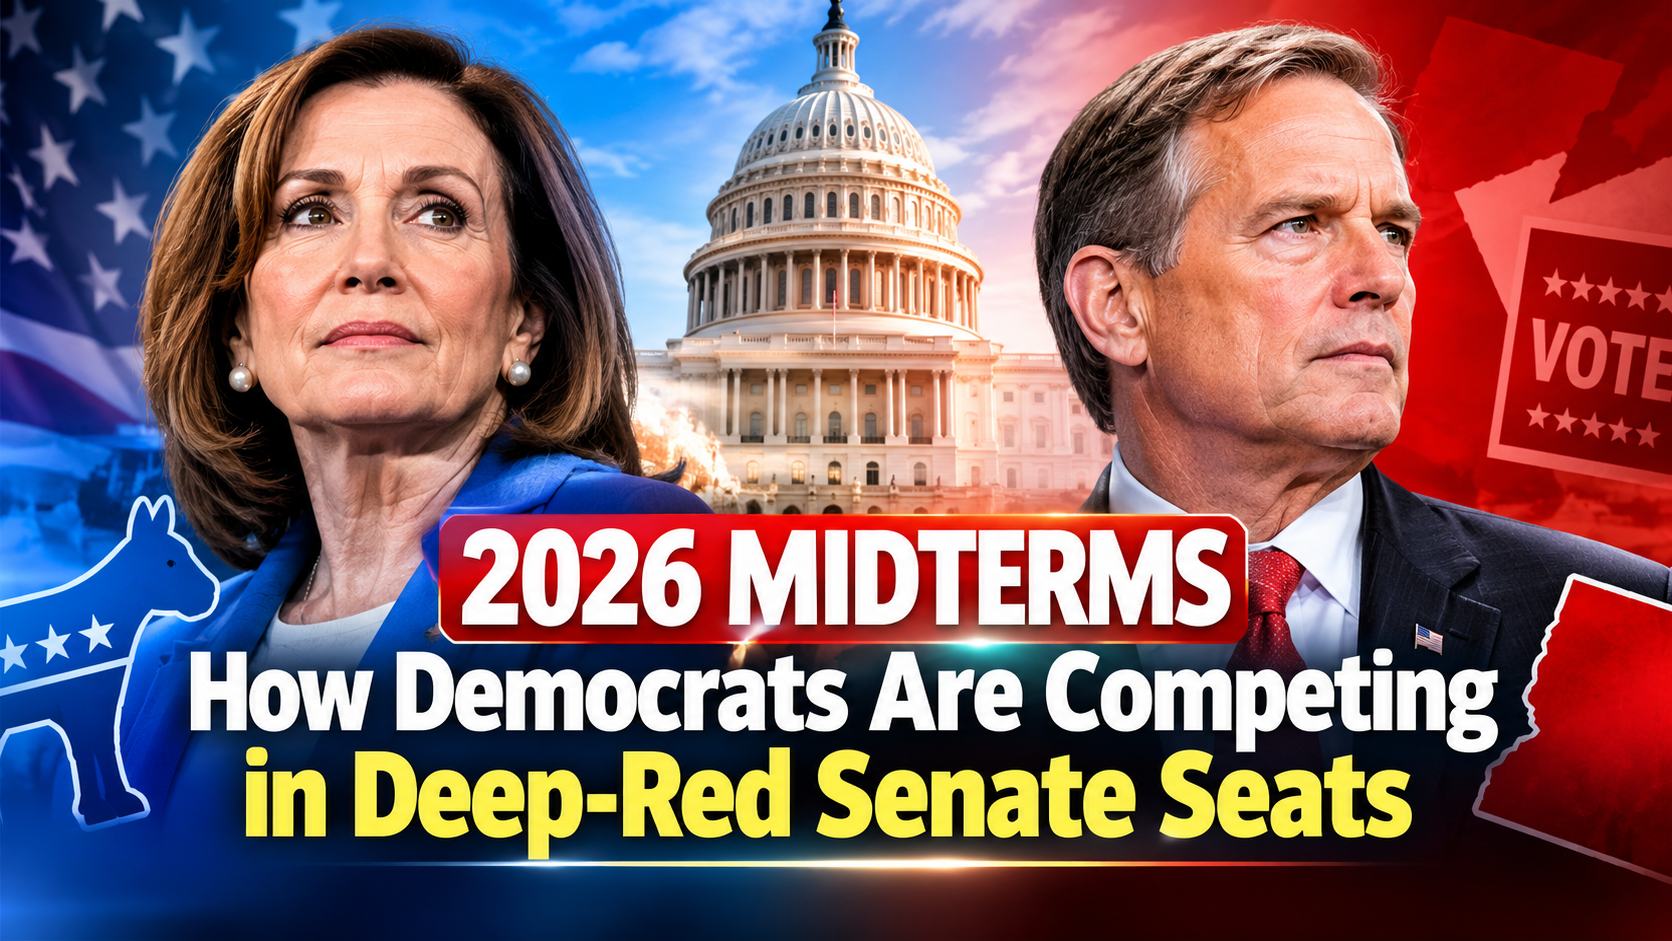
The defining feature of the 2026 Senate cycle isn’t a single flippable seat — it’s how many states once considered structurally out of reach for Democrats have moved onto competitive target lists simultaneously. Nate Silver’s FLIPR model now shows Democrats polling ahead or within striking distance in Texas, North Carolina, Maine, Alaska, Iowa, and Ohio — a map that, six months earlier, would have been dismissed as aspirational rather than analytical.
Table of Contents
The Core Dynamic: PVI Erosion in “Safe” Republican Territory
The Cook Partisan Voter Index (PVI) measures how a state or district leans relative to the national average, and it has historically been treated as a reliable ceiling on Democratic competitiveness in deep-red states. What’s shifted in 2026 is not the underlying PVI scores themselves — Texas remains a nominally red state, and Maine remains a state Trump has never carried — but the gap between a state’s structural partisan lean and its real-time polling, which has widened sharply against Republicans in a way PVI alone doesn’t capture.
Maine is the clearest illustration: it’s rated roughly D+7 on partisan lean, yet Sen. Susan Collins has won five consecutive terms there by cultivating a moderate, Trump-skeptical brand. Analysts now describe her erosion with independents — tied to her votes on Medicaid cuts and reconciliation packages — as the reason a state that “should” have been competitive for over a decade is only now genuinely rated a Toss-up.
Texas: The Marquee Case Study
The Talarico-Paxton matchup is the highest-profile test of whether Republican dominance in Texas is genuinely eroding or whether this is simply an unusually weak GOP nominee in an otherwise stable red state:
- Ken Paxton (R), the state attorney general, defeated incumbent Sen. John Cornyn in the Republican primary after securing Trump’s endorsement — but enters the general election carrying a well-documented history of legal controversies and a contentious, highly publicized divorce that both national and Texas-specific coverage flags as a real drag on his numbers.
- James Talarico (D), a state representative, has posted a consistent, modest polling lead and is rated by FLIPR with roughly a 60.7% win probability, and by Nate Silver’s initial model assessment at launch as high as 63%.
- The race is rated “Lean Democrat” by FLIPR — a rating with almost no modern precedent for a Texas federal race, given the state hasn’t elected a Democratic senator since 1988.
The Texas dynamic is instructive precisely because it may not generalize: Paxton’s specific vulnerabilities are candidate-level, not structural, meaning a stronger Republican nominee in a future cycle could plausibly restore the state’s traditional partisan lean even if Talarico wins in 2026.
In the 2026 midterms, Democrats are competitive in traditionally Republican Senate seats including Texas, Maine, North Carolina, Alaska, Iowa, and Ohio. Texas Democrat James Talarico leads Republican Ken Paxton in polling, while Maine’s Susan Collins faces her toughest re-election in three decades against Democrat Troy Jackson.
Maine: A Nominee Swap Adds Volatility
Maine’s race has been unusually chaotic even by midterm standards. Oyster farmer and military veteran Graham Platner won the Democratic primary over Gov. Janet Mills with progressive backing, but withdrew in July 2026 following sexual assault allegations and other controversies. Democrats replaced him with Troy Jackson, the former state Senate president, at a nominating convention on July 25 — leaving Democrats running a late-entry candidate against a five-term incumbent with 30 years of brand-building in the state.
Despite the disruption, Collins — the only Senate Republican representing a state Trump has never carried in three presidential runs — remains, per CNN’s Senate rankings, the single most vulnerable Republican incumbent in the chamber. Her position illustrates the core thesis of this cycle: candidate-level erosion (Collins’s declining favorability with both parties) is compounding with structural disadvantage (Maine’s D+7 lean) in a way that has finally overcome her historical resilience.
North Carolina: A More Conventional Battleground
North Carolina represents the more traditional version of a competitive Republican-held seat: former Gov. Roy Cooper (D), a proven statewide winner, faces former RNC Chairman Michael Whatley (R), the expected GOP nominee. Sabato’s Crystal Ball moved this race from “Leans Republican” to “Toss-up” alongside Maine — placing it in the same tier of competitiveness as Georgia and Michigan, two Democratic-held seats, illustrating how the overall map has shifted toward parity rather than a clean partisan split.
Suburban and Independent Voter Shifts
Across every competitive race — Texas, Maine, North Carolina, and the newer additions of Alaska, Iowa, and Ohio — the same demographic driver recurs in analyst commentary: independent and suburban voters moving away from Republican candidates, tied to dissatisfaction with reconciliation-package votes (particularly Medicaid provisions), economic anxiety over gas prices, and a broader erosion in Trump’s approval rating, which FLIPR’s inputs place at roughly 38% nationally with only 22% strong approval. This pattern — suburban erosion compounding with base-level fatigue — is structurally similar to the dynamic that drove Democratic gains in the 2018 midterms, though the current map extends into more traditionally rural, red-leaning states than 2018’s suburban-centric wave did.
Why This Matters Beyond November 2026
If Democrats do flip seats in states like Texas, Maine, or North Carolina, it would suggest a durable erosion in Republican strength beyond the specific unpopularity of individual 2026 candidates — with implications for the 2028 presidential map. If, conversely, Republicans hold these seats despite unfavorable national conditions, it would suggest FLIPR and similar models are overweighting national environment relative to the genuine structural advantages (partisan registration, rural turnout patterns, incumbency) that have insulated red states from Democratic gains in prior cycles.
Finally ,The 2026 Senate map has expanded well beyond the traditional handful of swing states, with Democrats competitive in Texas, Maine, North Carolina, Alaska, Iowa, and Ohio simultaneously. Texas (Talarico vs. Paxton) and Maine (Collins vs. Jackson) represent two distinct versions of the same underlying story — one driven primarily by candidate-level Republican vulnerability, the other by a decades-long erosion of a moderate incumbent’s independent support finally catching up with the state’s structural partisan lean.
Discover more from The Monitor
Subscribe to get the latest posts sent to your email.



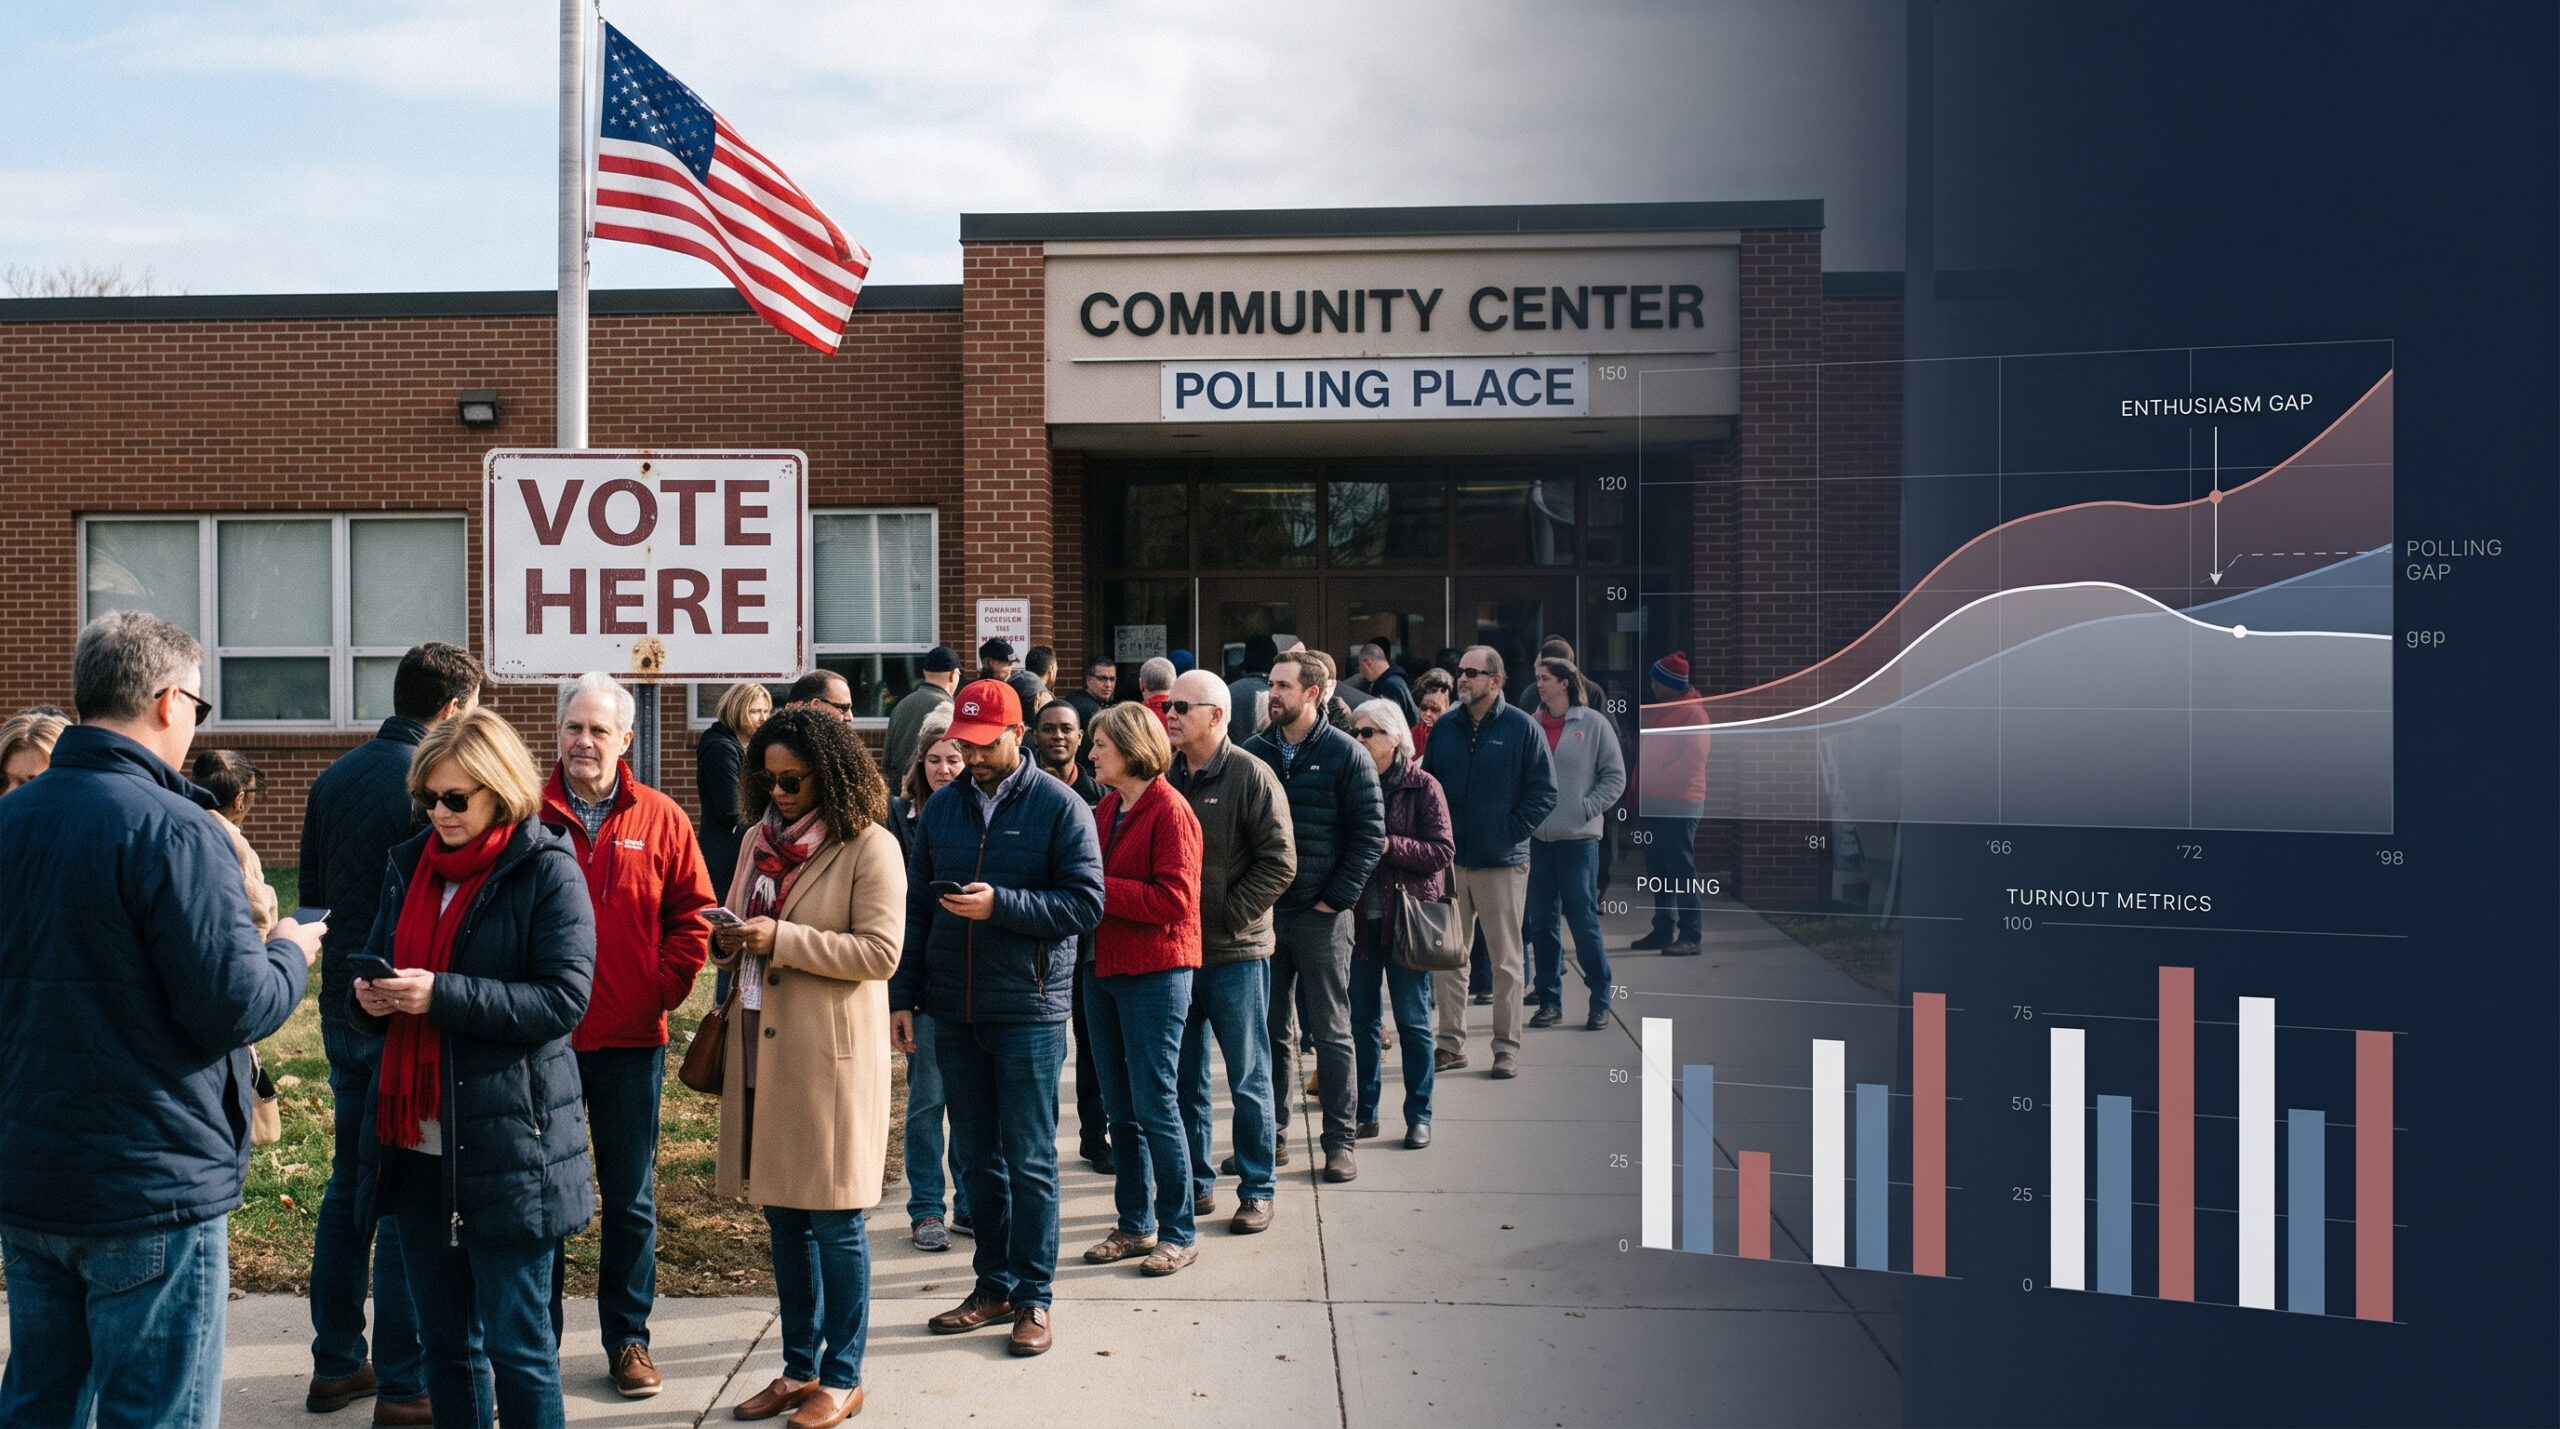
Polls and primary turnout show Republicans trailing on enthusiasm ahead of the 2026 midterms. Here’s what the data shows, where it’s weaker, and what could change.
Key Takeaways
- A Washington Post-Ipsos poll conducted July 8 to 13, 2026, found Democrats ahead 48% to 45% among registered voters, but ahead by about eight points among voters who say they are absolutely certain to vote.
- Democrats have outpaced Republicans in primary turnout. As of late June, about 12.6 million votes had been cast in Democratic House primaries, compared with 8.6 million in Republican primaries, according to a Washington Post analysis cited by commentators.
- Analysis of six states that held comparable primaries in 2022 and 2026 found the Republican-to-Democratic turnout ratio moved toward Democrats in every case.
- Special elections since 2025 have shown Democrats running ahead of their 2024 presidential margins, though special elections draw low turnout and are not reliable predictors.
- Enthusiasm is a leading indicator, not a result. Historically, the gap between stated enthusiasm and votes cast has been large, and the November outcome depends on who actually turns out.
Search Intent Summary
Readers searching this topic usually want to know whether Republicans are less motivated to vote in 2026, what the numbers show, and how much weight to give them. This article reviews the polling, primary turnout, and special election evidence, then sets out the strongest arguments on each side.
What “Enthusiasm” Measures
Political scientists use several overlapping measures. Pollsters ask respondents how enthusiastic they are about voting, how certain they are to vote, and whether they consider the upcoming election more important than past ones. Each measure captures something different, and results vary by question wording.
The key distinction is between opinion and turnout. Enthusiasm tells you how motivated a group feels. Turnout tells you how many people actually vote. Historically, the two do not always match, and the party with lower enthusiasm can still turn out strongly if its voters are organized and its contests are high-stakes.
What the Polls Show
The broadest signal comes from national surveys. In a February 2026 Washington Post-ABC News-Ipsos poll, 47% of registered voters planned to back Democrats and 45% Republicans. The gap was sharpest among younger voters. The poll found that 51% of 18-to-39-year-olds who voted for Donald Trump in 2024 said they were certain to vote, compared with 77% of Harris voters in the same age group.
By July, the Washington Post-Ipsos poll had narrowed the overall margin. Democrats led 48% to 45% among registered voters, down from a five-point edge in May. The enthusiasm gap, however, had widened. The same survey showed Democrats’ lead expanding to about eight points among those who said they were absolutely certain to vote.
Other measures point the same way. A Post-ABC poll found 73% of Democrats said the upcoming midterms were more important than past midterms, compared with 52% of Republicans. In the same survey, 72% of Republicans said they would definitely vote. A Marquette University Law School poll found 28% of Republicans and Republican-leaning independents described themselves as “very enthusiastic” about voting in the midterms.
These results should be read carefully. A generic-ballot lead of a few points is well within polling error, and the enthusiasm gap is a difference between two groups’ stated motivation, not a measured vote.
Primary Turnout: The Stronger Signal
Primary turnout is a more concrete measure than survey responses, because it counts actual ballots. Primary electorates are small and self-selected, so they are not a clean preview of a general election. Still, they show who is showing up when the stakes are visible.
Commentary citing a Washington Post analysis reported that by late June 2026, about 12.6 million ballots had been cast in Democratic House primaries, compared with 8.6 million in Republican primaries. Democrats set turnout records in several states, including Wisconsin, Michigan, Texas, and Georgia, according to the same analysis.
The statistician Charles Stewart III, of MIT’s Election Data and Science Lab, compared turnout in the six states that held statewide primaries in both 2022 and 2026: Arkansas, Illinois, Nebraska, North Carolina, Ohio, and Texas. In every one, the ratio of Republican to Democratic primary turnout moved toward Democrats. In his analysis, Democratic turnout rose while Republican turnout fell. Stewart also noted that primary turnout is not always predictive of general election outcomes, and that many factors influence it.
Those findings are not uniform. Closed primary systems, contested races, and candidate quality all shape turnout. A competitive Republican primary in one state can boost that party’s turnout even when enthusiasm elsewhere is weak.
Special Elections: A Pattern, With Caveats
Special elections have produced consistent Democratic overperformance. An analysis by The Down Ballot, reported in a column that cited it, examined 110 special elections since January 2025 and found Democrats running an average of 12.5 points ahead of their 2024 presidential margins. In 2025, Decision Desk HQ found an average overperformance of about 20 points in US House specials.
Special elections are a useful signal but a weak forecast. They draw low turnout, usually from the most motivated voters, and they are held under conditions that differ from a midterm. Analysts have noted that Democrats overperformed in special elections before the 2024 presidential race, then lost the national popular vote. Special elections can show shifts in motivation without predicting how a broader electorate will vote.
The Republican Case
Republicans and some analysts offer several counterarguments, and they deserve a fair hearing.
Enthusiasm is not the same as turnout. Republicans have historically turned out reliably in midterms when their voters were motivated by specific issues or candidates, and the party’s organizational infrastructure is strong.
Low-turnout special elections and primaries can exaggerate the energy of whichever side is more engaged in a given contest, and Democratic primary turnout partly reflects contested races that drew heavy spending.
Polls of enthusiasm can shift quickly. A few months before an election is a long time, and a single event, such as a major policy action or a change in the economic outlook, can reshape voter motivation.
The party also argues that its message on the economy and taxes resonates with voters who may not register strongly in polling. In the July Post-Ipsos poll, the top concern among voters was the economy, and some Republicans have argued their affordability messaging will close the gap as the election approaches.
The Democratic Case
Democrats point to the same data as evidence of an energized base. They argue that primary turnout records, special election swings, and the enthusiasm gap show a motivated electorate.
Democratic strategists also argue that the war with Iran, rising gasoline prices, and cost-of-living pressures have hurt the incumbent party. Pricing and economic concerns dominate voter priorities, according to the Post-Ipsos poll. The Post poll noted that more than 70% of Democrats regard voting as more important this year than before.
What to Watch Before November
Several indicators will show whether the gap is real or temporary.
Watch whether enthusiasm translates into actual turnout in the fall. Early voting and absentee data in competitive states will be more reliable than polls.
Watch the composition of turnout. A widening gap among younger voters, the group the February poll singled out, would matter more than overall numbers.
Watch Republican primary turnout in states that still have contests, and compare it with 2022 benchmarks.
Watch the economic and foreign policy environment. Gasoline prices, inflation, and the status of the Iran conflict all feed into voter priorities, as covered in our Iran policy analysis and the crude oil article.
Practical Takeaways
For readers following the midterms, the most useful habit is to weight actual turnout data above survey enthusiasm when assessing the outlook, and to treat both as indicators rather than predictions. Enthusiasm polls are a useful early signal, but they often change before voting.
For campaigns and analysts, the data points to the importance of turnout operations in the weeks before the election, regardless of which party’s enthusiasm numbers look stronger.
This article describes the evidence and the arguments on each side. It does not forecast the outcome of the midterms.
Future Outlook
The enthusiasm gap is a clear signal in the data so far, particularly in primaries and specials. Whether it turns into a general election advantage depends on turnout operations, on how the economy and foreign policy evolve, and on how many voters decide late. Those questions remain open.
Frequently Asked Questions
Are Republicans less enthusiastic about voting in 2026?
Several national polls show lower stated enthusiasm among Republicans than Democrats, including a Washington Post-Ipsos poll from July 2026 and a Marquette University Law School poll. Enthusiasm measures vary by question, so no single poll settles the question.
Does primary turnout predict the midterms?
Primary turnout is a useful signal but not a reliable forecast. It reflects who participates in primaries, which are smaller and more self-selected than general elections. Changes in turnout relative to earlier cycles can indicate shifts in motivation, but they do not determine outcomes.
Do special elections predict general election results?
Special elections show trends in voter motivation, but they draw low turnout and occur under different conditions than midterms. In 2024, Democrats overperformed in special elections before losing the national vote. Treat them as one input among many.
What is the enthusiasm gap?
The enthusiasm gap is the difference between parties in how motivated their supporters say they are to vote. Pollsters measure it by asking how enthusiastic or certain respondents are to vote. It is a measure of stated motivation, not a measure of votes.
Discover more from The Monitor
Subscribe to get the latest posts sent to your email.
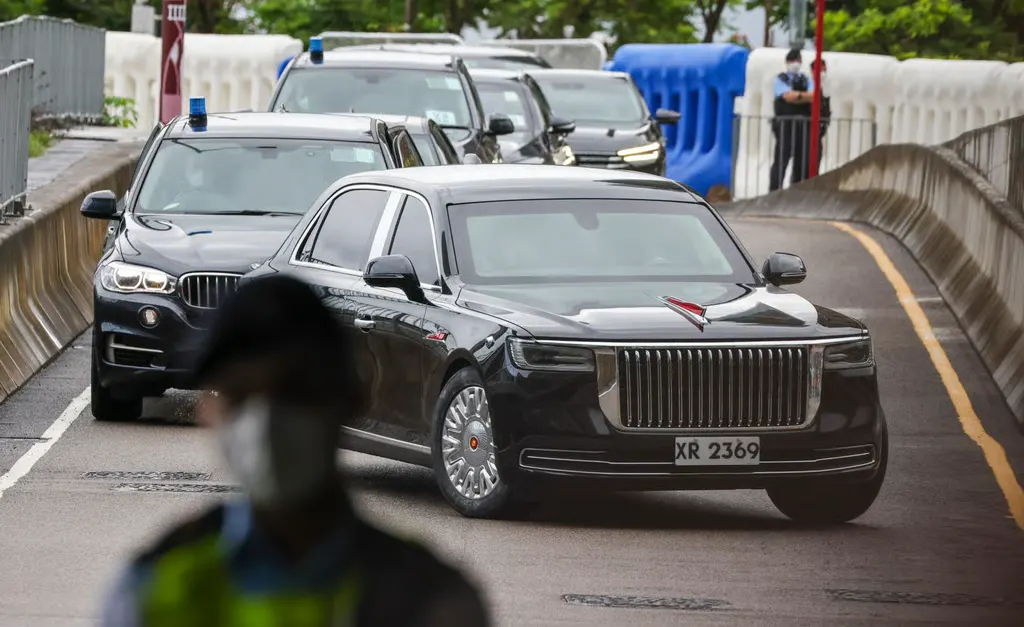
When global superpowers meet at international summits, the battle for dominance extends beyond closed-door negotiations to the tarmac. For decades, the US President’s armored limousine—popularly dubbed “The Beast”—stood unchallenged as the world’s ultimate mobile fortress. Today, Chinese President Xi Jinping travels the globe in a custom-built, ultra-secretive flagship: the Hongqi N701.
Designed to project national strength and protect head-of-state sovereignty, the Hongqi N701 represents China’s technological independence and automotive maturity, standing toe-to-toe with America’s legendary presidential liner.
1. Hongqi N701: Beijing’s Secretive Armored Vault
Manufactured by state-owned FAW Group Corporation, the name Hongqi translates directly to “Red Flag”—a marque inextricably linked with the Communist Party hierarchy since 1958.
The N701 (a internal codename for a vehicle limited to roughly 50 custom builds over a decade) represents the pinnacle of Chinese security engineering. Unlike commercial luxury vehicles modified by aftermarket armorers, the N701 is purpose-built from the chassis up as a diplomatic defense unit according to official coverage by NDTV Auto.
Key Features of the Hongqi N701:
- Structural Architecture: Measuring over 5.5 meters (18 feet) in length with an extended wheelbase, the vehicle features reinforced steel composite plating and high-grade ballistic glass engineered to withstand heavy gunfire and explosive blasts.
- Propulsion Systems: Powered by either an in-house developed 6.0-liter V12 engine generating approximately 408 horsepower or a high-output turbocharged V6 hybrid setup documented in Chinese patent filings reported by LiveMint.
- CBRN Defense: Features a sealed cabin equipped with an independent air-compression and filtration management system designed to protect against chemical or biological warfare attacks.
- Mobility Integrity: Rides on 21-inch custom security wheels fitted with heavy-duty run-flat tires capable of fleeing ambush zones even under total deflation.
2. “The Beast”: America’s 10-Ton Rolling Bunker
Operating under the fleet designation Cadillac One, the US Presidential State Car is built by General Motors under strict Secret Service supervision. Detailed in military and automotive records curated on Wikipedia’s Official State Car History, the current generation of The Beast is built on a heavy-duty GMC TopKick commercial truck platform disguised under classic Cadillac sedan styling.
Defensive Features of The Beast:
- Heavy Armor Plating: Constructed with five-inch-thick dual-hardness steel, aluminum, titanium, and ceramic matrix armor plating. Its eight-inch-thick doors weigh as much as a cabin door on a Boeing 757 airliner.
- Unter-Carriage Protection: Features a five-inch shatterproof reinforced steel plate along the underbody to survive improvised explosive devices (IEDs) and landmines.
- Offensive Countermeasures: Outfitted with tear gas cannons, smoke screen dispensers, night-vision optics, and door handles capable of sending electric shocks to unauthorized intruders.
- Medical Readiness: The rear compartment houses an oxygen supply system and a temperature-controlled blood bank containing samples matching the President’s blood type.
Comprehensive Specifications Matrix: Hongqi N701 vs. “The Beast”
| Parameter / Feature | Hongqi N701 (China) | Cadillac One “The Beast” (USA) |
| Manufacturer | FAW Group (Hongqi) | General Motors (Cadillac) |
| Base Platform | Custom Heavy-Duty Sedan / SUV Chassis | GMC TopKick Truck Chassis |
| Estimated Weight | ~3,150 – 4,500 kg (3.5 – 5.0 tonnes) | 6,800 – 9,100 kg (7.0 – 10.0 tonnes) |
| Overall Length | ~5.5 meters (~18 feet) | ~5.5 meters (~18 feet) |
| Engine / Powertrain | 6.0L V12 (408 hp) or 3.0L V6 Hybrid | 6.6L Duramax V8 Turbo-Diesel |
| Armor Thickness | Classified (High-Grade Ballistic Steel & Glass) | 5-inch body armor, 8-inch door armor |
| Cabin Environment | Hermetically Sealed with Air Recirculation | Hermetically Sealed with Oxygen Supply |
| Tire Protection | Reinforced 21-inch Run-Flats | Kevlar-Reinforced Goodyear Run-Flats |
| Emergency Medical | Secure Comms & First Aid Systems | On-board Blood Supply & Medical Oxygen |
| Production Run | ~50 units over 10 years | Secret Service Fleet (~15–25 units) |
3. Symbolic Statecraft: Soft Power vs. Military Might
The diplomatic significance of state cars extends far beyond ballistic defense. They represent a nation’s industrial competence and soft power on the global stage.
China’s “Red Flag” Revival
For decades, Chinese leaders relied on imported foreign luxury vehicles during official duties. Xi Jinping’s explicit mandate to revive Hongqi reflects a push for industrial self-reliance. By deploying the N701 during high-stakes state visits to San Francisco, Europe, and Asia, Beijing signals to world leaders that domestic Chinese manufacturing can produce state vehicles on par with Western standards.
America’s Mobile Command Structure
The Beast embodies American defense capability and expeditionary power. Flown worldwide aboard Boeing C-17 Globemaster military transports prior to presidential arrivals, the vehicle operates as a rolling extension of the White House, complete with encrypted satellite comms connecting directly to the Pentagon and Vice President.
The Verdict: Parity in Executive Security
While General Motors’ The Beast remains heavier and heavily geared toward military-grade defensive countermeasures, China’s Hongqi N701 matches it in executive protection, cabin threat isolation, and symbolic authority. China has closed the luxury security gap—ensuring that when two superpower leaders meet, their mobile fortresses command equal respect.
Discover more from The Monitor
Subscribe to get the latest posts sent to your email.

Key Takeaways
- On September 15, 2026, Republican Rep. Thomas Massie (R-Ky.) introduced a 34-page, eight-article resolution to impeach Defense Secretary Pete Hegseth, centered on the ongoing U.S. war in Iran.
- Massie’s resolution is privileged, meaning it forces a House floor vote within two legislative days regardless of leadership’s wishes.
- Massie gave GOP leadership no advance notice — an intraparty break that deepens his rift with President Trump and House leadership.
- The Pentagon called the impeachment push baseless, with press secretary Kingsley Wilson defending Hegseth as a “transformative leader.”
- A separate, six-article impeachment push against Hegseth was already introduced by House Democrats in April 2026 — meaning Hegseth now faces impeachment efforts from both parties, though both are considered near-certain to fail in a GOP-controlled House.
What Massie’s Resolution Actually Alleges
The eight articles of impeachment accuse Hegseth of:
- Violating the War Powers Resolution of 1973 by continuing U.S. military action in Iran after Congress passed resolutions in June and July directing troop withdrawal.
- Failing to minimize civilian casualties, citing a strike on a school in Minab that Iranian officials say killed more than 100 children.
- Directing the operation that captured former Venezuelan leader Nicolás Maduro without congressional authorization.
- Broader military actions in Venezuela and Yemen conducted, Massie argues, outside constitutional and statutory limits.
Massie told reporters the push was about placing “a marker in history,” not about realistic prospects of success: “Doing this wasn’t predicated on whether it could succeed or not.”
Why Massie Moved Now
Massie said the timing was deliberate — Speaker Mike Johnson had effectively wound down the legislative calendar ahead of the midterms, leaving the privileged resolution as his last mechanism to force a recorded vote on the war before recess.
The Political Backdrop
The Congressional Budget Office estimated the Iran conflict has cost $38 billion to date and contributed to inflation rising from 2.3% to 5.3% in the second quarter of 2026 — a figure directly tied to the oil-price dynamics covered in our companion piece on the Dow’s reaction to Middle East tensions.
Notably, Massie’s move came the same day House Democrats were separately pursuing a symbolic impeachment vote against President Trump himself, creating a rare moment where both parties had impeachment measures moving through the chamber simultaneously.
What Happens Next
Because the resolution is privileged, House leadership has two options: allow a floor vote on impeachment itself, or move to table (kill) the resolution — the more likely outcome given GOP control of the chamber. Either path forces individual Republicans onto the record regarding the administration’s Iran war conduct heading into the midterms.
Did the House vote to impeach Pete Hegseth?
As of September 15, 2026, Rep. Thomas Massie forced the impeachment resolution to the floor using a privileged motion, requiring a House vote within two legislative days. The resolution is widely viewed as almost certain to fail or be tabled given Republican control of the House.
Discover more from The Monitor
Subscribe to get the latest posts sent to your email.

Andy Harris in 2026: Freedom Caucus Influence, Spending and Congressional Power

MLB Playoffs 2026: Postseason Format, Broadcast Guide and How to Track the Bracket

Elon Musk Calls Mukesh Ambani the “Real Boss of India” Over Alleged Monopoly Concerns

Legal Pioneer and Defender of Justice: The Life, Works, and Legacy of Navi Pillay

Inside the Modern Republican Party Platform: Tax Policy, Immigration, and Governance

Anne Carson: Genius of Hybrid Forms and 2026 Nobel Laureate in Literature

Analyzing the Republican Voter Enthusiasm Gap: Turnout Metrics and Polling Data

The West Wing Legacy: Why the Political Drama Is More Relevant Than Ever

Remembering Kianna Underwood: The Nickelodeon Actress Behind “All That” and “Little Bill”

Pakistan Warns UN Security Council of AI Risks to Global Peace and Equality

Min Ah: The Global Impact and Rising Popularity of the K-Drama Star
Inside the Modern Republican Party Platform: Tax Policy, Immigration, and Governance

Fortress Diplomacy: How China’s Secretive Hongqi N701 Matches America’s Legendary “Beast”
Anne Carson: Genius of Hybrid Forms and 2026 Nobel Laureate in Literature
Remembering Kianna Underwood: The Nickelodeon Actress Behind “All That” and “Little Bill”
Analyzing the Republican Voter Enthusiasm Gap: Turnout Metrics and Polling Data

Jennifer Garner’s Latest Projects: Business Ventures Beyond Hollywood
Elon Musk Calls Mukesh Ambani the “Real Boss of India” Over Alleged Monopoly Concerns
-

 Featured6 years ago
The Right-Wing Politics in United States & The Capitol Hill Mayhem
-

 News5 years ago
Prioritizing health & education most effective way to improve socio-economic status: President
-

 China5 years ago
Coronavirus Pandemic and Global Response
-

 Democracy5 years ago
Missing You! SPSC
-

 Canada5 years ago
Socio-Economic Implications of Canadian Border Closure With U.S
-

 Conflict5 years ago
Kashmir Lockdown, UNGA & Thereafter
-
Democracy5 years ago
President Dr Arif Alvi Confers Civil Awards on Independence Day
-

 Digital6 years ago
Pakistan Moves Closer to Train One Million Youth with Digital Skills