
Analysis
Nasdaq AI Stock Sell-Off: Tech Correction Masks Market Gains


The screen bled red across the trading floors of Lower Manhattan on Tuesday, pulling the curtain down on a euphoric 18-month rally. As the closing bell rang, a brutal Nasdaq AI stock sell-off had wiped out 3% of the index’s value, vaporising hundreds of billions in market capitalisation in mere hours. Yet, step away from the glare of the tech titans, and the picture shifts entirely. Small-cap industrials, regional banks, and consumer staples quietly advanced. This was not a panic. It was a surgical, deeply concentrated liquidation event targeting the very silicon and software giants that have single-handedly dragged global markets to record highs.
To understand the severity of this capital rotation, one must look at the immense concentration risk that preceded it. By late May, just five artificial intelligence bellwethers accounted for roughly 30% of the S&P 500’s total market weighting. This is a historical anomaly surpassing even the dot-com peak of early 2000. Institutional portfolios had become dangerously top-heavy. When momentum cracked, the reversal was violent.
Data from financial market trackers at Reuters revealed that trading volumes for semiconductor equities surged 45% above their 30-day moving average during the afternoon session. This mass exit eclipsed the broader market’s reality. According to global market analysis from Bloomberg, the S&P 500 equal-weight index actually closed in positive territory, highlighting a stark bifurcation. Investors aren’t fleeing equities; they’ve simply decided to cash out their AI lottery tickets and move funds into the forgotten corners of the real economy.
The mechanics of a Nasdaq AI stock sell-off rarely start with a scream; they start with a whisper in the options market. On Monday evening, institutional hedging activity spiked, signalling that major funds were quietly locking in profits on their semiconductor and cloud computing holdings. By Tuesday morning, that defensive posturing erupted into outright selling.
The trigger was a combination of stretched valuations and exhaustion. Nvidia, which had priced in a near-perfect trajectory of endless exponential growth, saw its forward price-to-earnings multiple rejected by the market. When shares of the chipmaker plunged, it dragged the entire semiconductor index down with it. A market analysis brief from the Financial Times noted that almost $400 billion in semiconductor market capitalisation evaporated in the first 90 minutes of trading alone.
That is roughly equivalent to the entire GDP of Denmark vanishing before lunch.
Still, the destruction was highly selective. Software-as-a-service providers that had recently slapped artificial intelligence onto their investor decks without demonstrating corresponding revenue growth faced the harshest penalties. Valuations in this speculative tier contracted by double digits. The market is abruptly demanding proof of concept. Generative models are expensive to train, and Wall Street won’t fund the capital expenditure without a clear line of sight to immediate profitability.
Analysts at the International Monetary Fund recently warned of this exact vulnerability, calculating that tech sector multiples had become unmoored from historical norms, leaving them acutely exposed to sudden sentiment shifts. When the narrative changed, the algorithmic trading desks amplified the slide, triggering a cascade of automated stop-loss orders. Yet, the devastation was quarantined. Outside the tech-heavy indexes, the Dow Jones Industrial Average held steady, buoyed by traditional blue-chip stocks. This divergence reveals a market that isn’t experiencing a macro-economic failure, but rather a violent recalibration of pricing in its most overextended sector.
Why a Tech Sector Correction Was Inevitable
To view Tuesday’s rout as a sudden shock is to ignore months of flashing warning lights. The market had entered a phase of inelastic exuberance. Every mention of machine learning by a Chief Executive on an earnings call was met with a blind surge in share price, creating a dangerous feedback loop of capital misallocation. The fundamental laws of financial physics were suspended, but only temporarily.
Why are AI stocks dropping? They are falling because investors have realised that the timeline for artificial intelligence to generate enterprise-level profits is vastly longer than the timeline required to build the infrastructure. Valuations priced in immediate perfection, leaving no margin for delayed adoption, regulatory hurdles, or rising capital expenditure costs.
This tech sector correction is a symptom of market digestion. The “Magnificent Seven” and their supply chains had absorbed nearly all available retail and institutional liquidity over the past year. But as the third quarter approaches, the burden of proof is shifting. Companies are now expected to demonstrate exactly how their massive investments in graphics processing units translate into bottom-line free cash flow. For many, the math simply doesn’t add up yet.
That said, the rotation out of these names is structurally healthy. When capital pools exclusively in one sector, it starves the rest of the market of investment. The fact that capital is flowing from overvalued tech darlings into energy, materials, and healthcare suggests that the underlying economy remains resilient, even if the speculative edge has been blunted. The current semiconductor stock drop is stripping the froth from the market, punishing tourists who bought the ticker symbol rather than the balance sheet. We are witnessing a transition from a momentum-driven market to one that prioritises earnings quality. The era of the blank cheque has officially closed.
The downstream consequences of this capital rotation will reshape venture capital, corporate strategy, and perhaps even monetary policy over the next 12 months. The immediate victim will be the private markets. Startup founders who have spent the last year riding the coattails of public market valuations will face a brutal awakening. Seed funding rounds that previously commanded astronomical valuations based on a sleek demo will now face rigorous due diligence. The hurdle rate for new capital just went up.
For corporate boards, the message is equally stark. The market will no longer reward performative spending. Executives who have engaged in an arms race to acquire compute power will now be pressured by activist investors to justify those expenditures. If the infrastructure doesn’t yield margin expansion or significant productivity gains, those tech budgets will be slashed. This creates a secondary risk for the chip designers and cloud providers: their current revenue run-rates are highly dependent on this very corporate arms race. If enterprise spending slows, the revenue models of the tech giants will need to be drastically revised.
From a macroeconomic perspective, this deflation of the AI market bubble may actually provide the Federal Reserve with a measure of comfort. According to research published by the World Bank, hyper-concentrated equity rallies can create artificial wealth effects that complicate inflation targeting. By cooling off the most speculative corners of the market, the central bank may find it easier to manage the broader economic glide path without triggering a deep recession. The destruction of paper wealth in Silicon Valley doesn’t immediately translate to job losses on Main Street. Instead, the normalisation of a Nasdaq 100 decline removes a significant source of systemic risk. The coming quarters will be defined by an intense focus on margins, operational efficiency, and the arduous task of turning a dazzling science project into a viable corporate utility.
What follows, however, is fiercely debated. Not everyone interprets this sell-off as a return to fundamental sanity. A vocal contingent of market strategists argues that abandoning the trade now is akin to selling internet infrastructure stocks in 1998 — a premature exit from a generational wealth-creation cycle.
Their argument rests on the sheer scale of the technological shift. Generative models aren’t merely a new software vertical; they are a general-purpose technology comparable to the internal combustion engine or electricity. A recent analysis by the OECD points out that artificial intelligence integration could increase global labour productivity by up to 1.5 percentage points annually over the next decade. If that thesis holds true, the current valuations of the top silicon producers and cloud hyper-scalers are actually conservative, not stretched.
From this perspective, Tuesday’s decline is nothing more than a momentary blip. It is viewed as a liquidity-driven shakeout designed to clear weak hands from the market. The bulls argue that the massive capital expenditures by the tech giants aren’t a sign of excess, but a necessary moat-building exercise. They contend that the broader market is overestimating the risk of delayed adoption and underestimating the exponential curve of computing power. If they are right, the capital rotating into defensive stocks today will eventually be forced back into the tech sector at a severe premium, missing the next massive leg of the rally.
The tension between these two realities — the undeniable long-term transformative power of machine learning and the immediate, punishing math of overextended equity valuations — will dictate market dynamics for the foreseeable future. Tuesday’s brutal correction was not an indictment of the technology itself, but a rejection of the timeline investors had assigned to it. The market is demanding a return to financial gravity. Capital hasn’t evaporated; it has simply grown impatient, seeking refuge in the unglamorous, cash-generating sectors of the old economy while the new economy figures out its business model.
The AI revolution is far from over, but the easy money has already been made.
Discover more from The Monitor
Subscribe to get the latest posts sent to your email.



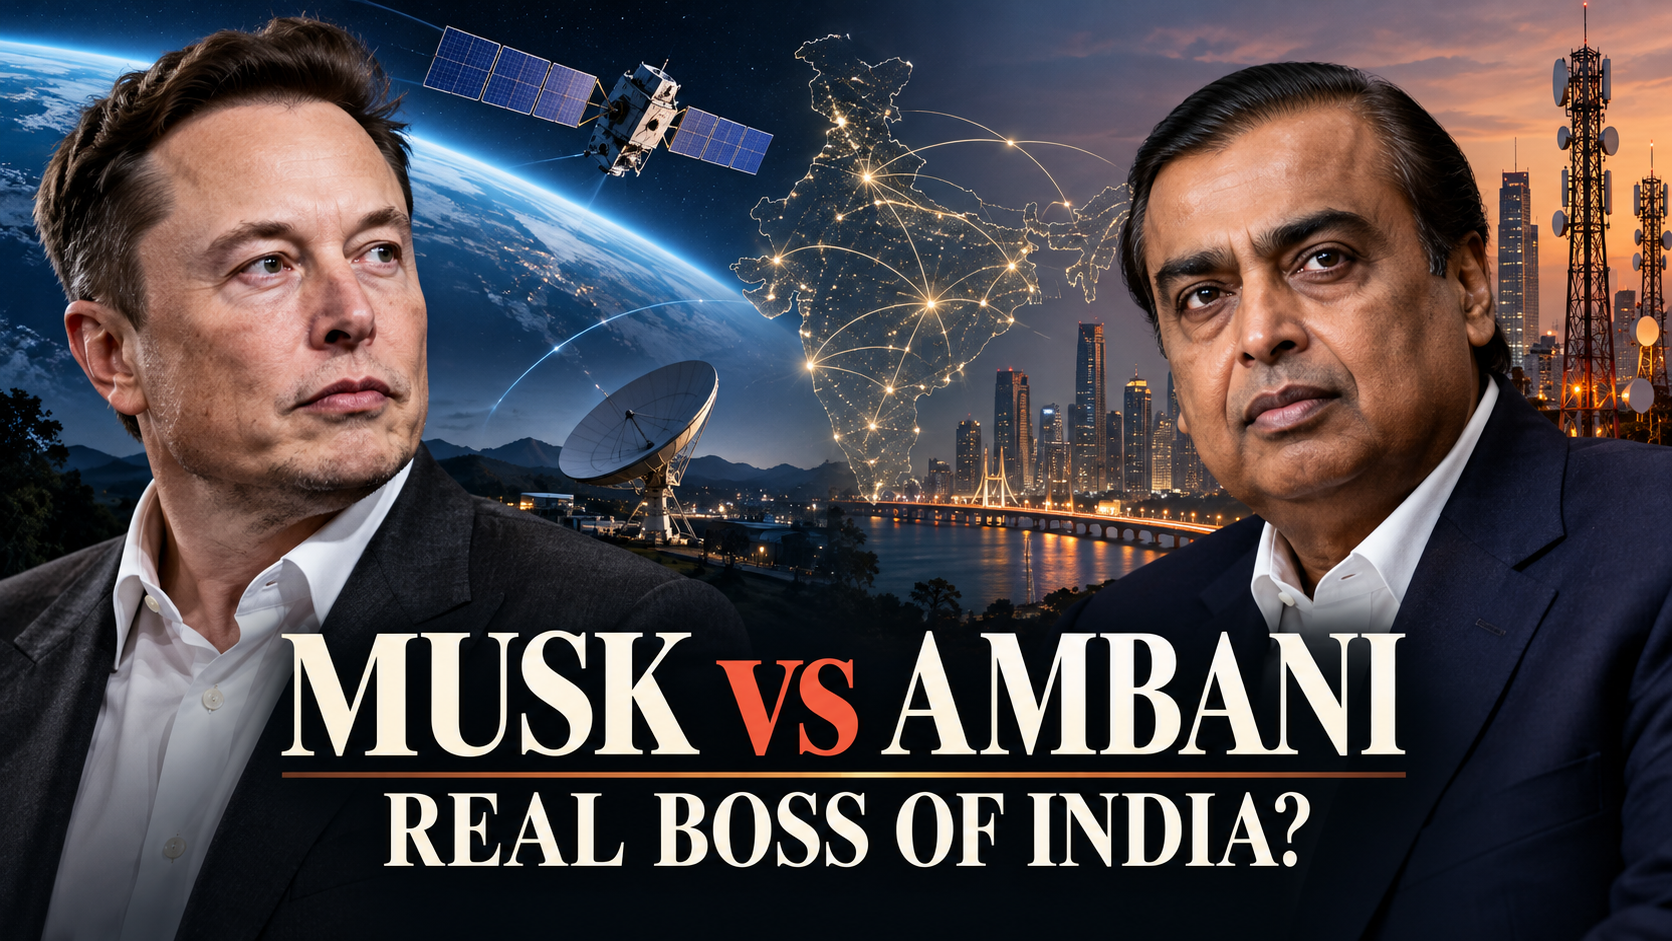
SpaceX CEO Elon Musk has escalated a public dispute over Starlink’s delayed commercial launch in India, sarcastically addressing Reliance Industries Chairman Mukesh Ambani as “Prime Minister Ambani” and questioning whether he holds outsized influence over the country’s telecom landscape. The remarks, posted on X in early October 2026, center on claims that entrenched interests—particularly around Reliance Jio—are slowing satellite broadband approvals to protect market dominance. Indian authorities have rejected the accusations as baseless, emphasizing a uniform regulatory process for all licensed satellite operators. Bloomberg
Musk’s Escalating Posts and Arguments for Starlink
Musk first accused unnamed “oligarchs” of blocking Starlink to maintain a “monopolistic chokehold on the Indian people,” describing the situation as “a crime against the people of India.” He followed by asking, “Is Ambani the real boss of India?” after noting that Starlink is licensed in over 165 countries and has spent five years complying with Indian requirements. In a subsequent post addressed as “Dear Prime Minister Ambani,” he offered a “humble apology” for not recognizing Ambani’s role and urged him to allow competition, arguing that satellite internet could connect underserved areas. Times of India
Musk highlighted potential benefits: improved access for children to education, opportunities for small businesses to reach global markets, and life-saving connectivity during natural disasters when terrestrial networks fail. He later pushed back against critics, stating that competition would benefit Indian consumers with more choices, that Ambani “is not going out of business,” and that Starlink would need affordable pricing to gain traction. Times of India
Government Position: No Monopoly, Uniform Rules for All Licensees
Union Communications Minister Jyotiraditya Scindia has directly addressed the claims, stating that “India does not allow a monopoly in any sector.” He confirmed that three companies hold Global Mobile Personal Communication by Satellite (GMPCS) licences: Starlink, Reliance’s Jio Satellite Communications, and Bharti-backed Eutelsat OneWeb. All three are at a similar regulatory stage and can begin commercial services only after each individually completes security clearances (assessed primarily by the Ministry of Home Affairs) and the government finalizes the revenue-based spectrum charging framework. CNBC TV18
The Department of Telecommunications has described suggestions of discriminatory treatment as “baseless and misconceived.” Security requirements include data localization, lawful interception capabilities, Indian gateways, and related technical demonstrations—conditions that apply equally across licensees. Spectrum assignment is set to be administrative rather than auction-based, with a usage charge of around 5% of adjusted gross revenue (lower for rural/remote areas) nearing finalization with the Telecom Regulatory Authority of India. Business Standard
Starlink’s Approval Timeline and Remaining Hurdles
Starlink received its GMPCS licence from the Department of Telecommunications in June 2025 and IN-SPACe authorization for its Gen-1 constellation in July 2025, following years of engagement that began with an application around November 2022. Provisional spectrum for testing has been available in some cases, but commercial operations require the outstanding security clearances and spectrum assignment. OneWeb and Jio Satellite secured earlier licences but face the same final milestones. Amazon’s Project Kuiper has also expressed interest and is under review. Business Standard
India’s Telecom Landscape and Connectivity Gaps
Reliance Jio remains India’s largest wireless operator, with roughly 500–530 million connections and about 39% market share as of mid-to-late 2026 data, closely trailed by Bharti Airtel at around 38%. Together the two private players dominate the market, with Vodafone Idea and BSNL holding smaller shares. Jio has driven significant growth in 5G adoption and fixed broadband. TelecomLead
Despite high overall coverage, a digital divide persists. TRAI and related data show India with over 1.09 billion internet subscriptions as of early 2026, but rural penetration stands at about 48 subscriptions per 100 people versus roughly 127 in urban areas. Large numbers of people live within mobile broadband footprints yet do not use the internet, with rural-urban gaps remaining notable. Satellite services are positioned by regulators as particularly suited for remote, border, hilly, and island areas that are harder to serve with terrestrial infrastructure. Government programs such as BharatNet continue expanding fiber and mobile coverage in villages. The Policy Edge
Broader Implications
The exchange underscores tensions between global satellite broadband ambitions and national regulatory, security, and competitive frameworks in one of the world’s largest telecom markets. Proponents of faster Starlink entry argue it could accelerate connectivity in hard-to-reach areas and introduce pricing and service competition. Authorities maintain that the process prioritizes security, data protection, and a level playing field among multiple licensed players rather than favoring any single incumbent. As of mid-October 2026, commercial satellite broadband services from any of the three licensees have not yet launched, pending the completion of remaining individual clearances and spectrum finalization.
Musk’s posts have drawn responses from opposition figures, including Rahul Gandhi, but the core dispute remains centered on the pace and nature of regulatory approvals for satellite internet in India. Further clarity is expected once security assessments conclude and the spectrum pricing regime is formally implemented.
Discover more from The Monitor
Subscribe to get the latest posts sent to your email.

“Min Ah” is one of the most searched names in Korean drama, and it points to more than one actress. The one driving the biggest buzz right now is Shin Min-a.
Key Takeaways
- Biggest news: Shin Min-a stars as Empress Navier in Disney+’s The Remarried Empress, which premieres November 4, 2026, per Soompi.
- Cast: Ju Ji-hoon plays Emperor Sovieshu, Lee Se-young plays Rashta, and Lee Jong-suk plays Prince Heinrey.
- Scale: the story is based on a web novel and webtoon that recorded about 2.97 billion cumulative global views as of July 2026, and it is Disney+’s first K-romance fantasy (SBS Star).
- Name confusion: other well-known “Min Ah” performers include Kang Min-ah and Minah (Bang Min-ah) of Girl’s Day. This article explains who is who.
| Name | Known for | Latest news |
|---|---|---|
| Shin Min-a | Leading roles in major dramas and films | The Remarried Empress (Nov 4, 2026) |
| Kang Min-ah | Actress represented by H&Entertainment | Drama Sympathetic Cells with Kim Myung-soo; premiere date announced June 2026 (MyDramaList) |
| Minah (Bang Min-ah) | Former Girl’s Day member turned actress | Born May 13, 1993; Girl’s Day debut in 2010 (Dramabeans) |
Shin Min-a’s Next Big Role: The Remarried Empress
Disney+ confirmed on August 26 that the series would premiere on November 4, releasing a teaser and character posters (Soompi). The story follows Navier, the “perfect empress” of the Eastern Empire, who is told by her husband that he wants a divorce after he falls for a runaway slave, Rashta. Instead of accepting defeat, Navier asks permission to remarry, choosing the prince of a rival kingdom.
Release plan
According to industry coverage, the ten-part series will debut with a four-episode drop and then release two episodes each Wednesday through a November 25 finale, and it streams on Hulu in the U.S. (Resonate). The same report says the first three episodes will screen at the Busan International Film Festival, which runs October 6–15.
Why it matters
This is the clearest sign of how K-drama has become a global asset. Platforms are paying for fantasy adaptations of internet-born stories with huge built-in audiences, and they are casting established leads to carry them.
Why Shin Min-a’s Popularity Travels
- Longevity. She has worked consistently in Korean drama since the early 2000s, and her credits on MyDramaList span more than two decades (MyDramaList).
- Genre range. From romantic comedy to Netflix thriller Karma and a 2026 film, The Eyes, in which she plays dual roles (MyDramaList).
- Global platforms. Disney+, Netflix, and Hulu give Korean series simultaneous worldwide releases.
The Other “Min Ah” Actresses
Kang Min-ah
A Seoul-born actress with credits since the 2010s. MyDramaList lists a 2026 drama, Sympathetic Cells, with Kim Myung-soo, whose premiere date was announced in June (MyDramaList).
Minah (Bang Min-ah)
She debuted with Girl’s Day in 2010, made her acting debut on the tvN variety program Roller Coaster, and later won a Best New Actress trophy at the 2013 Gwangju International Film Festival for the film Holly. She led the 2020 film Snowball, which earned a Screen International Rising Star Asia Award at the New York Asian Film Festival (Dramabeans).
How to Search the Right Person
Add the family name: “Shin Min-a,” “Kang Min-ah,” or “Bang Minah.” Spelling varies in English (Min-a, Mina, Min Ah), which is why results get mixed.
Frequently Asked Questions
Who is Min Ah in K-drama?
There are several, but the most prominent right now is Shin Min-a, starring in The Remarried Empress.
When does The Remarried Empress premiere?
November 4, 2026, on Disney+ (Soompi).
Who is in the cast?
Shin Min-a, Ju Ji-hoon, Lee Jong-suk, and Lee Se-young.
Is Min Ah the same as Minah from Girl’s Day?
No. Minah is Bang Min-ah, a different performer (Dramabeans).
How popular is the source story?
The webtoon had about 2.97 billion global views as of July 2026 (SBS Star).
Whichever Min Ah you were searching for, the pattern is the same: Korean drama talent now finds its audience everywhere at once.
Discover more from The Monitor
Subscribe to get the latest posts sent to your email.
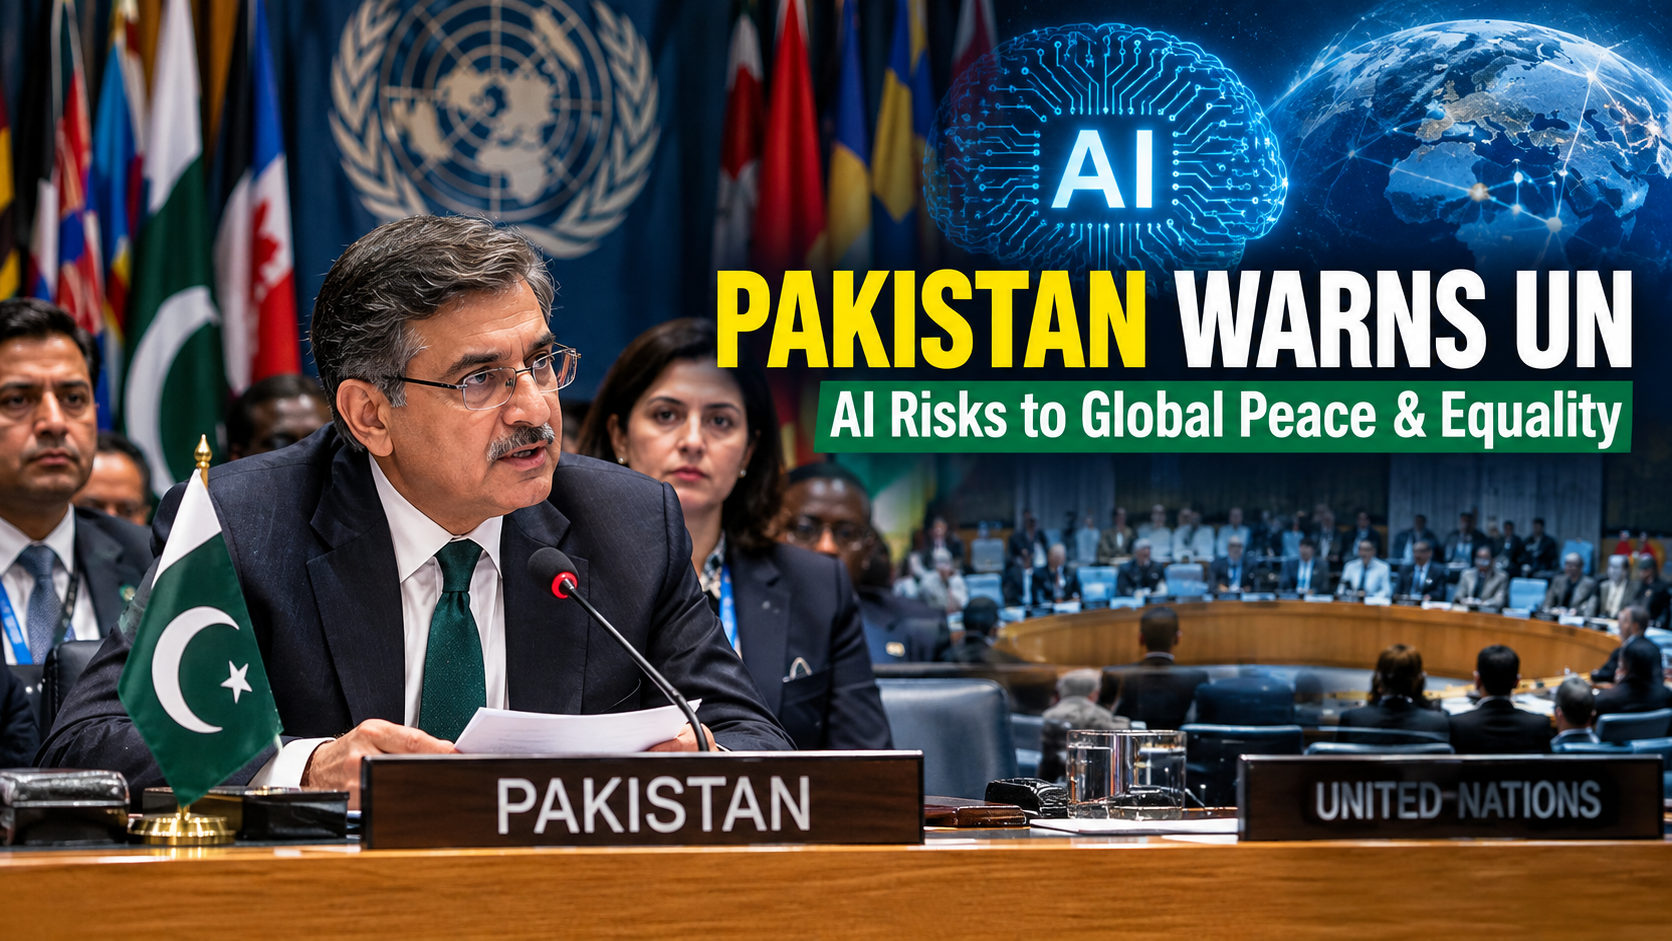
UNITED NATIONS — September 24, 2026: Pakistan has warned the United Nations Security Council that the rapid and insufficiently regulated development of artificial intelligence could deepen global inequality while creating new risks to international peace and security.
Speaking during a Security Council briefing on “Artificial Intelligence and International Security,” Pakistan’s Deputy Prime Minister and Foreign Minister Senator Mohammad Ishaq Dar called for stronger international safeguards, regulatory frameworks and governance mechanisms to address the risks associated with increasingly powerful AI systems.
Dar emphasized that the international community needs coordinated action to establish guardrails around artificial intelligence, particularly as AI technologies become increasingly relevant to military decision-making, information systems and national security.
Pakistan Calls for International Guardrails on Artificial Intelligence
Pakistan’s intervention comes as governments and international institutions increasingly debate how AI should be governed across borders.
Dar stressed the importance of restraint and confidence-building measures in the military domain, particularly because AI-assisted systems could compress decision-making timelines and increase the danger of miscalculation.
The concern is significant because artificial intelligence is no longer confined to civilian applications. AI is increasingly being examined in relation to cyber operations, intelligence analysis, autonomous systems, information warfare and other security-sensitive areas.
The United Nations has also warned that AI can create substantial risks when technological development moves faster than international governance.
The UN’s existing AI framework emphasizes responsible, accountable, transparent and human-centered development, while calling for effective human oversight of AI systems.
Why AI Is Becoming a Security Council Issue
The Security Council has previously considered artificial intelligence as a potential factor affecting international peace and security, but the technology has developed rapidly since those early discussions.
A recent analysis by the independent Security Council Report identified several security implications, including AI’s ability to facilitate malicious cyber activity, accelerate the creation and distribution of misinformation and disinformation, and influence military operations.
The organization also highlighted concerns surrounding increasingly autonomous weapons systems, shortened decision-making timelines and questions about human oversight and accountability.
These concerns help explain why AI has moved beyond being primarily a technology-policy issue and increasingly become a subject of international security diplomacy.
The challenge for governments is that AI can simultaneously create opportunities and risks.
AI could help countries identify emerging conflicts, improve humanitarian operations, monitor ceasefires and analyze large quantities of information. At the same time, poorly governed systems could amplify security threats or make already complex conflicts more difficult to manage.
Pakistan Highlights the Global Inequality Dimension
Pakistan’s message to the Security Council went beyond military applications.
Dar also emphasized the need for AI development to be representative, transparent and inclusive, reflecting concerns among developing countries that the benefits of advanced artificial intelligence could become concentrated among a relatively small group of technologically advanced states and companies.
That concern is already reflected in the United Nations’ Global Digital Compact.
The Compact calls for closing digital divides, expanding access to the benefits of the digital economy and strengthening international governance of artificial intelligence. It specifically calls for full and equal representation of countries, including developing nations, in international AI governance.
This makes AI access and governance part of a broader development question.
Countries with advanced computing infrastructure, large datasets, sophisticated research institutions and substantial private-sector investment are positioned differently from nations that remain dependent on imported technologies and have limited domestic AI capacity.
If that gap widens, AI could potentially reinforce existing economic and technological inequalities rather than reduce them.
UN Framework Already Calls for Inclusive AI Governance
The debate at the Security Council is taking place alongside a broader UN effort to develop international mechanisms for AI governance.
The Global Digital Compact, adopted as part of the Pact for the Future, established a framework for international cooperation on digital technologies and AI.
The United Nations has subsequently established an Independent International Scientific Panel on Artificial Intelligence and a Global Dialogue on AI Governance.
The first annual Global Dialogue took place in Geneva in July 2026, bringing together governments and other stakeholders to discuss international cooperation, AI opportunities and emerging risks.
The UN says the dialogue is intended to ensure that AI governance reflects the priorities of all nations rather than only those with the greatest technological capabilities.
For developing countries such as Pakistan, this process provides an avenue to raise questions about technological access, capacity-building, data governance and participation in international rule-making.
AI and Military Decision-Making Raise Particular Concerns
One of the most sensitive areas in the AI debate is military decision-making.
AI can process enormous volumes of information far faster than humans. That capability could potentially assist military planners and governments, but it also raises questions about what happens when decisions involving force are increasingly influenced by automated systems.
A shorter decision-making cycle can create pressure to respond before human officials have fully evaluated the available information.
That is why Pakistan’s emphasis on restraint and confidence-building is significant in the context of international security.
The broader UN position has also stressed the importance of retaining meaningful human control over decisions involving the use of force.
The central issue is not simply whether AI should be used in security applications, but how governments can establish accountability when AI-assisted systems contribute to consequential decisions.
Disinformation Adds Another Layer of Risk
AI-generated content presents another challenge for governments and international organizations.
Generative AI can make it easier to create convincing text, images, audio and video at scale. In a conflict environment, such capabilities could complicate efforts to distinguish authentic information from manipulated material.
The UN has identified misinformation and disinformation among the major concerns surrounding artificial intelligence, particularly where manipulated content can affect public trust, human rights or humanitarian operations.
For international institutions, the problem is therefore both technological and political: governments must develop mechanisms capable of addressing harmful AI-generated content without undermining legitimate expression or access to information.
Global AI Governance Is Becoming More Urgent
The current Security Council discussion reflects a larger international shift.
AI governance is no longer being discussed solely in terms of innovation, investment and economic competitiveness. Governments are increasingly considering questions involving national security, international stability, human rights, development and inequality.
The United States and China, for example, continue to compete technologically while also discussing mechanisms for AI safety and communication.
Meanwhile, the UN is developing a more inclusive multilateral framework intended to give countries a role in shaping international AI governance.
That creates an important distinction between AI development and AI governance.
The first concerns how quickly capabilities advance. The second concerns the rules, safeguards and institutions that determine how those capabilities are developed and deployed.
What Pakistan’s Position Means for Developing Countries
Pakistan’s intervention highlights an issue that is likely to remain central to future AI negotiations: who gets to shape the rules governing artificial intelligence?
Developing countries have an interest not only in managing AI-related risks but also in ensuring access to the technology’s potential benefits.
The UN’s Global Digital Compact recognizes the need for capacity-building, technology cooperation and support for developing countries to access, develop, use and govern AI systems.
That approach is particularly relevant as AI becomes increasingly connected to education, healthcare, agriculture, financial services, public administration and economic productivity.
Without adequate access to computing infrastructure, skills, data and investment, developing countries could find themselves primarily consuming technologies designed elsewhere.
Pakistan’s call for representative and inclusive AI governance therefore places technological development and international security within the same broader conversation.
The Challenge Ahead: Rules That Keep Pace With Technology
The Security Council’s latest discussion illustrates the central difficulty confronting policymakers.
Artificial intelligence is developing faster than many traditional regulatory processes can respond.
International rules must address security risks without unnecessarily blocking beneficial innovation. They must also account for differences between developed and developing countries while maintaining fundamental principles such as human rights, transparency and accountability.
The United Nations’ emerging governance architecture is an attempt to address that challenge through scientific assessment, international dialogue and greater participation by countries around the world.
Pakistan’s intervention adds another voice to that debate, particularly on the consequences of unequal access to AI capabilities and the risks associated with AI-assisted military decision-making.
Conclusion
Pakistan’s warning at the UN Security Council underscores the increasingly international character of the artificial intelligence debate.
The issue is no longer simply how quickly AI can advance. It is also about how the technology is governed, who participates in setting the rules, how military risks are controlled and whether the benefits of AI are distributed broadly enough to avoid deepening existing inequalities.
As AI becomes more deeply integrated into security, economies and public institutions, international cooperation will become an increasingly important part of managing both its opportunities and its risks.
For Pakistan and other developing countries, the emerging global AI governance system will be particularly important because the rules established today could influence access to technology, economic opportunities and participation in future international decision-making for years to come.
Discover more from The Monitor
Subscribe to get the latest posts sent to your email.

Elon Musk Calls Mukesh Ambani the “Real Boss of India” Over Alleged Monopoly Concerns

Legal Pioneer and Defender of Justice: The Life, Works, and Legacy of Navi Pillay

Inside the Modern Republican Party Platform: Tax Policy, Immigration, and Governance

Anne Carson: Genius of Hybrid Forms and 2026 Nobel Laureate in Literature

Analyzing the Republican Voter Enthusiasm Gap: Turnout Metrics and Polling Data

The West Wing Legacy: Why the Political Drama Is More Relevant Than Ever

Remembering Kianna Underwood: The Nickelodeon Actress Behind “All That” and “Little Bill”

Min Ah: The Global Impact and Rising Popularity of the K-Drama Star

Pakistan Warns UN Security Council of AI Risks to Global Peace and Equality

Best iPhone 18 Pro Max Cases: Premium Protection for Apple’s 2026 Flagship
Pakistan Warns UN Security Council of AI Risks to Global Peace and Equality

Bloodhound Q50: Remembering the Tragic Loss of Chicago’s Rising Drill Star

Remembering Eliana Moreno: The Legacy of NBC LA’s “Eli in the Heli”

Horror Box Office Economics: ROI, Market Share and the 2026

iOS 27 Release Date & Siri AI: The Ultimate Tech News Guide for iPhone 18 Users

Club América’s Financial Playbook: The Economics and Valuation of Latin American Football
Min Ah: The Global Impact and Rising Popularity of the K-Drama Star

Fortress Diplomacy: How China’s Secretive Hongqi N701 Matches America’s Legendary “Beast”
-

 Featured5 years ago
The Right-Wing Politics in United States & The Capitol Hill Mayhem
-

 News5 years ago
Prioritizing health & education most effective way to improve socio-economic status: President
-

 China5 years ago
Coronavirus Pandemic and Global Response
-

 Canada5 years ago
Socio-Economic Implications of Canadian Border Closure With U.S
-

 Democracy5 years ago
Missing You! SPSC
-

 Conflict5 years ago
Kashmir Lockdown, UNGA & Thereafter
-
Democracy5 years ago
President Dr Arif Alvi Confers Civil Awards on Independence Day
-

 Digital6 years ago
Pakistan Moves Closer to Train One Million Youth with Digital Skills